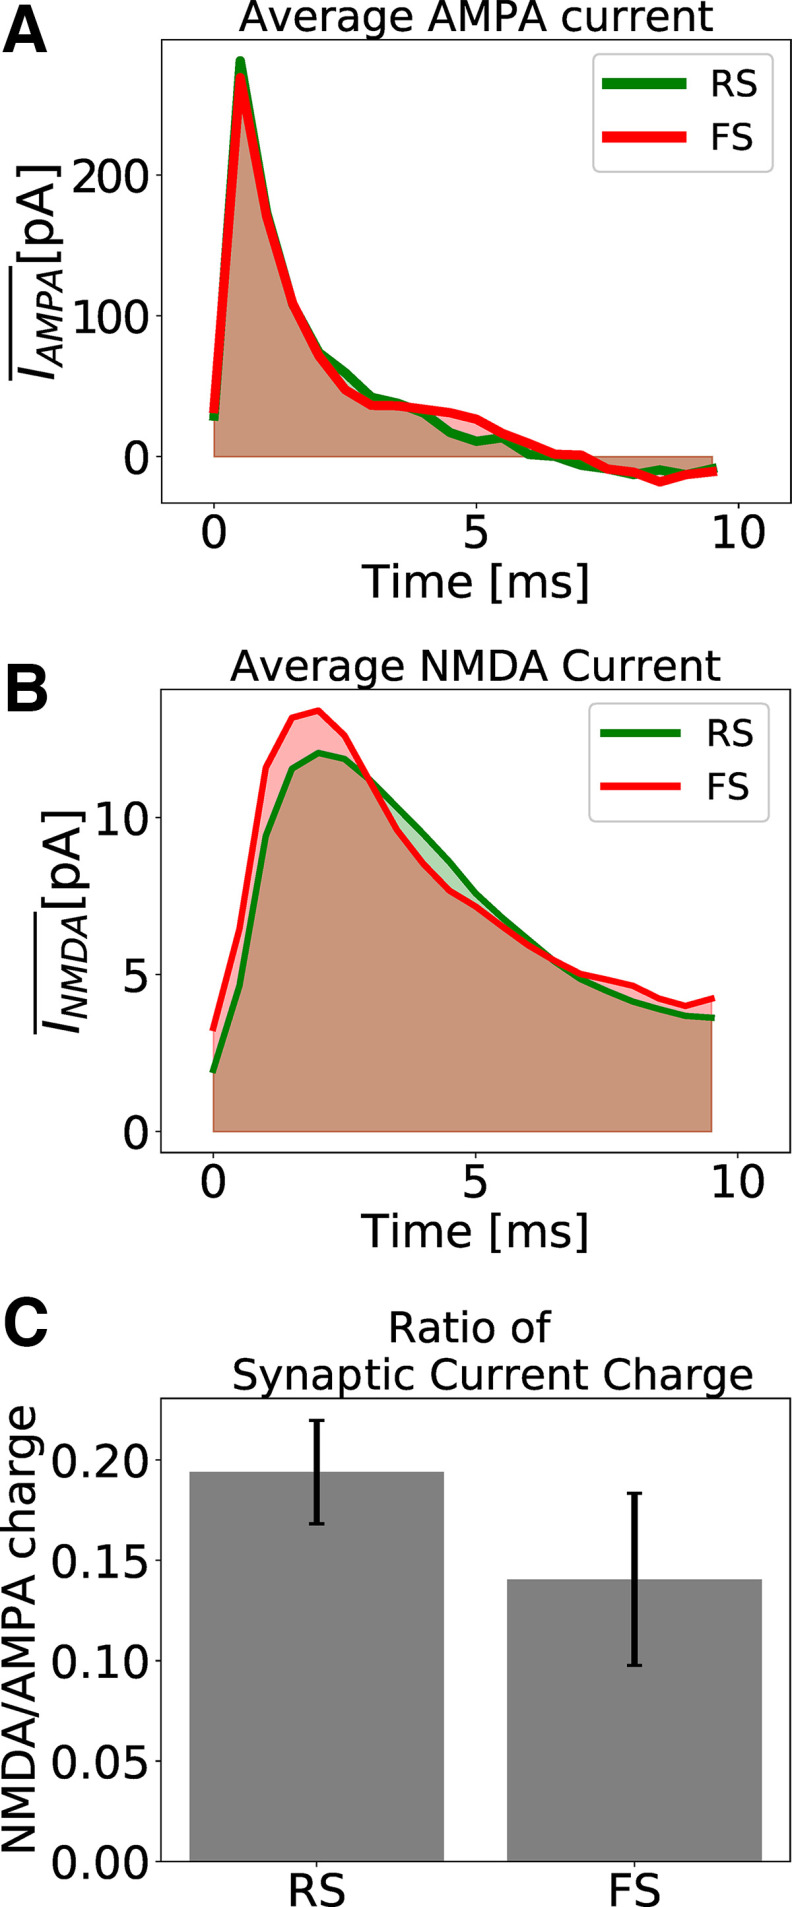
Figure 2.
Excitatory synaptic currents. A, Average AMPA current of one randomly picked RS (green) and one randomly picked FS (red) neuron. B, Average NMDA current of one randomly picked RS (green) and one randomly picked FS (red) neuron. C, Ratio of NMDA and AMPA charges for RS and FS cells. The synaptic charge ratio of each neuron was calculated separately. The Bars indicate the mean and the SD among the RS and FS population. The NMDA synaptic strengths in RS and FS cells are = 0.8 nS and = 1 nS (which, in our model, describes a healthy condition).

