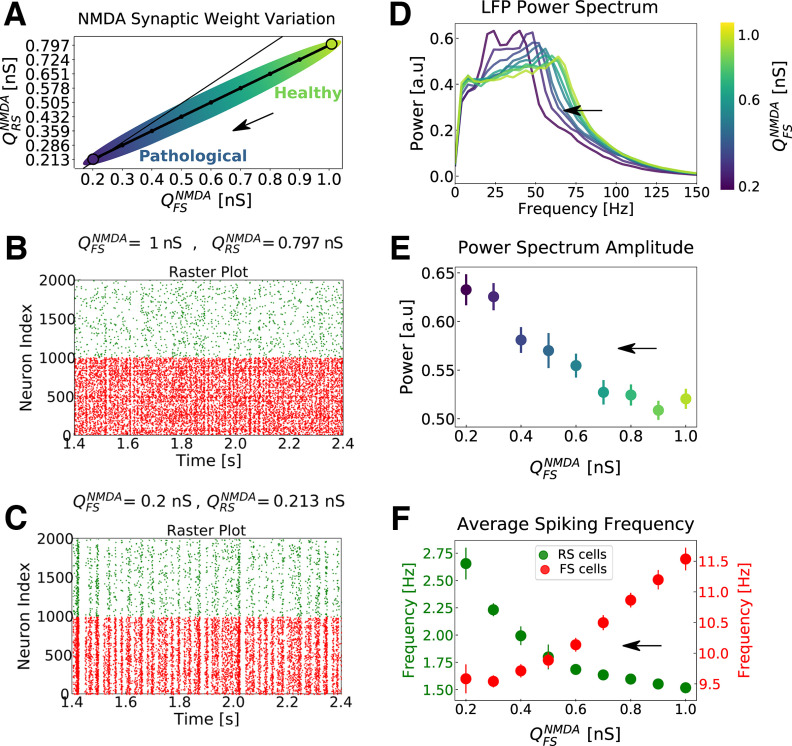
Figure 3.
Network dynamics with respect to different levels of NMDA channels block in the network. A, Possible trajectory in the parameter space of versus (NMDA synaptic strengths in RS and FS cells), mimicking the action of NMDA receptor (NMDAR) antagonists (the higher the intensity of the NMDAR antagonists, the smaller the NMDA synaptic strengths; same trajectory as that indicated in Fig. 1). The thin line indicates the identity for reference. The arrow indicates the progressive action of NMDAR antagonists. Points of higher synaptic strengths are associated with healthy conditions, while points with lower synaptic strengths are associated to pathologic conditions supposedly similar to the schizophrenic brain. B, C, Raster plots indicating the activity of only 1000 cells of each type (FS in red and RS in green), for two parameter sets. B, = 0.8 nS and = 1 nS. C, = 0.213 nS and = 0.2 nS. D, Average normalized Power Spectrum of the network LFP for different NMDA synaptic strength. The synaptic strengths follow the curve indicated in A, but only the values in FS cells ( ) are indicated in the color scale. Notice the shift of the Power Spectrum peak toward smaller frequencies with the increase of NMDA channel block. E, Power Spectrum peak amplitude with respect to the levels of NMDA channels block. Only the values of the NMDA synaptic strengths in FS cells ( ) are indicated in the x-axis. The color scheme (presented for better visualization) is the same as in D. SEMs are indicated as error bars. F, Average firing rate of RS (green) and FS cells (red) with respect to the trajectory in parameter space depicted in A. Like in E, only are indicated in the x-axis. SEMs are indicated as error bars. Results expressed in D–F are the outcome of 50 simulations average. In all simulations, an external drive of 3 Hz was used to maintain network activity in γ regime. See Materials and Methods.

