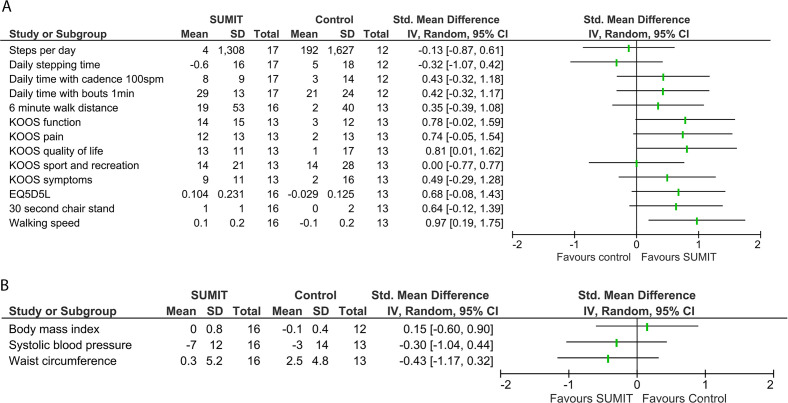
Figure 2.
(A) Forest plot comparing within group change scores between SUMIT and control groups. (B) Forest plot comparing within group change scores between SUMIT and control groups for health outcomes. EQ5D5L, Euroqual 5-Dimension 5-Level; IV, inverse variance; KOOS, Knee Osteoarthritis Outcome Score; SUMIT, SUpported Motivational InTerviewing.

