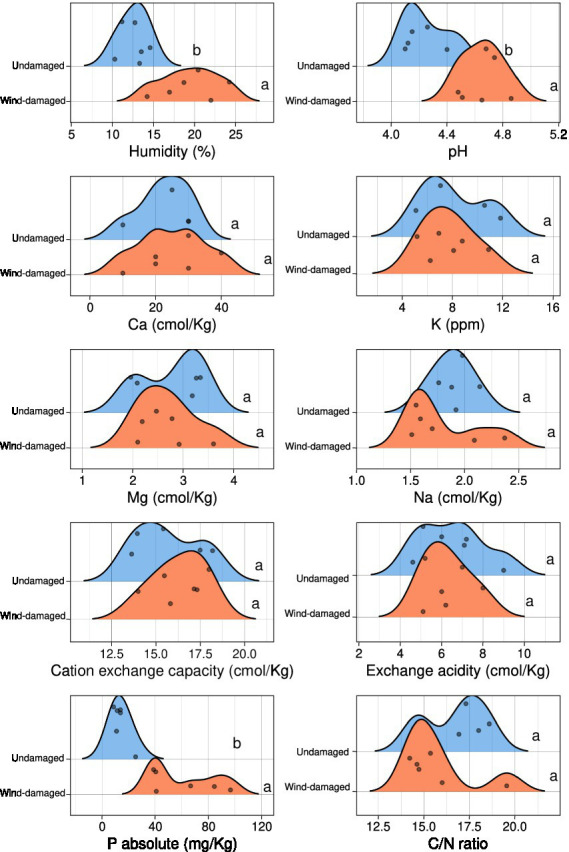
Figure 2.

Physico-chemical characteristics of soils collected near the same stumps and undamaged trees that were selected for metabarcoding. For each measurement, the density plots show the number of samples (represented by dots) having a specific value in the wind-damaged or undamaged area. Statistical significance is shown in letters (Kruskall-Wallis test 0.05 threshold).
