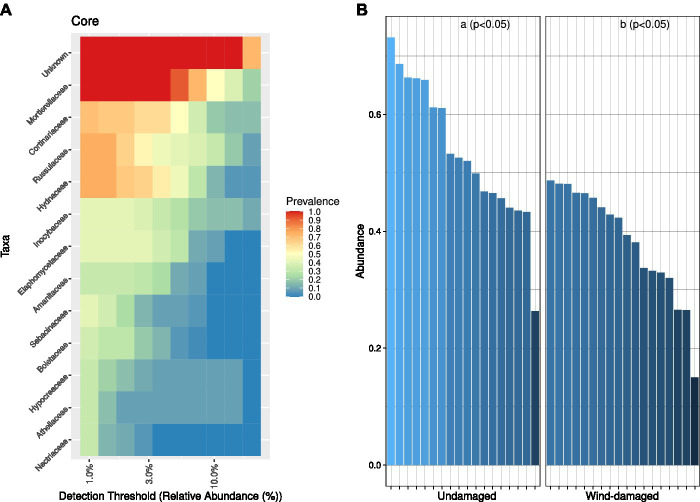
Figure 4.
Core fungal community analysis. (A) Core community composition in terms of predominance, i.e., the fraction of samples (1 = all samples and 0 = no sample) in which a specific family had at least the relative abundance defined on the x axis. For example, based on the representation, Mortierellaceae were present at 3% relative abundance in all samples, and at 10% ~50% of samples. (B) For each sample and sub-area, we divided the abundances of OTUs representing the core mycobiome, by the abundance of all OTUs (relative abundance). The core fungal community was more abundant in the undamaged area (Kruskall-Wallis test at p < 0.05).

