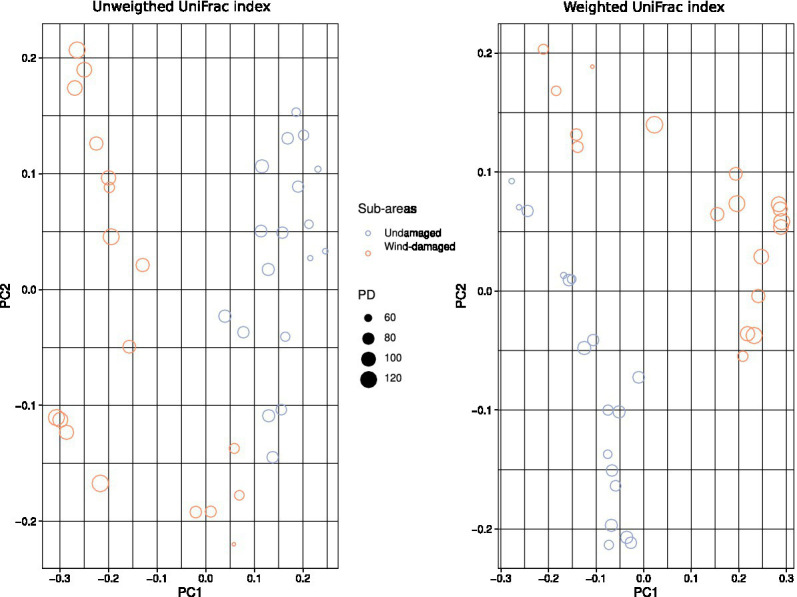
Figure 6.

Beta diversity calculations. The color and shapes of the dots represent undamaged vs. wind-damaged samples, and both weighted and unweighted UniFrac indices were calculated. The size of each dot (sample) is related to the Faith’s PD of that sample. Both indices highlight a separation of the two areas in terms of mycobiota composition.
