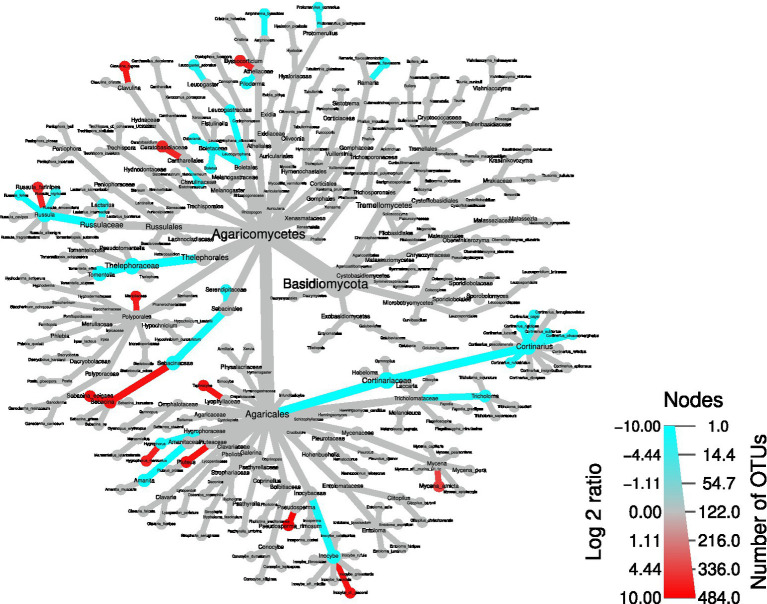
Figure 7.
Differential abundance tree showing differentially-abundant Basidiomycota in the wind-damaged vs undamaged areas. Red color for nodes and edges indicates over-representation in the wind-damaged condition, while blue indicates the opposite. The color intensities were calculated by summing all log2 fold changes of OTUs gathered at each node and branch.

