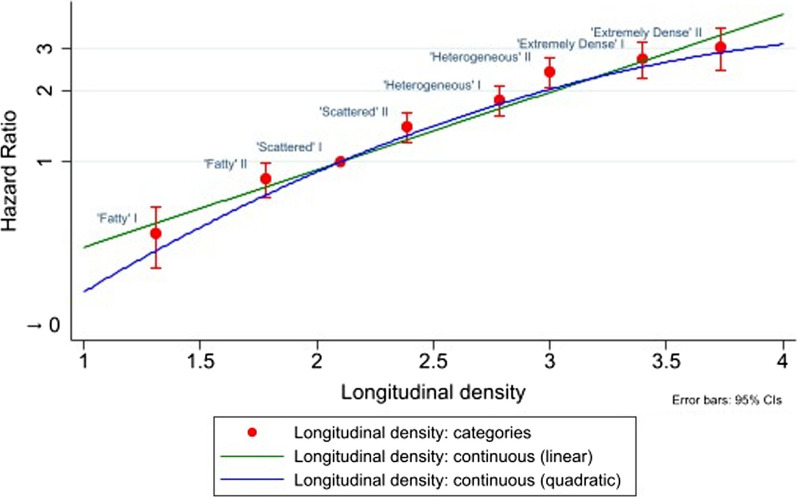
Fig. 1.
Adjusted hazard ratios for invasive breast cancer by longitudinal breast density (continuous and categorical). n = 132,439. Adjusted hazard ratios from proportional-hazards Cox models for the new longitudinal breast density measure (continuous, time-varying) or derived eight-category longitudinal breast density (time-varying) which was based on the continuous longitudinal breast density measure (reference = Scattered I). Hazard ratios adjusted for age at baseline (continuous) and time-varying BMI (continuous). ‘Time-varying’ means that a woman’s values for breast density and BMI are updated through time, i.e. at each screening examination. Categorical longitudinal density on the x-axis is the mean of the new longitudinal breast density measure (continuous) in each group. Units of longitudinal density are non-standard. 95% CIs from Wald tests. Y-axis on a log scale. Red circles represent the adjusted hazard ratios for invasive breast cancer by categorical longitudinal density, and the error bars represent the 95% CIs for the hazard ratios. Green line represents the adjusted hazard ratios for invasive breast cancer by continuous longitudinal density, fitted with a linear term only. Blue line (representing the final model used in the analysis) represents the adjusted hazard ratios for invasive breast cancer by continuous longitudinal density, fitted with a linear term and a quadratic term. BMI body mass index, 95% CI 95% confidence interval

