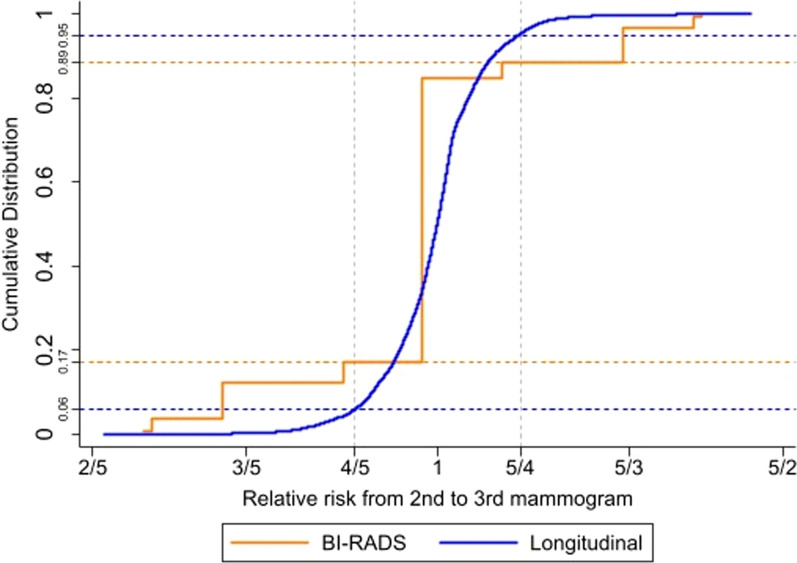
Fig. 3.
Cumulative distribution functions for relative risk of breast density (BI-RADS/longitudinal) from second to third mammogram. n = 76,313 (subgroup of women with at least 3 mammograms). Relative risks were calculated using the hazard ratios for density taken from the proportional-hazards Cox model fitted to the complete cohort for BI-RADS density (time-varying) or the new longitudinal breast density measure (time-varying; continuous; including a quadratic term), age at baseline (continuous) and BMI (time-varying; continuous). Corresponding observed values for BI-RADS density or the new longitudinal breast density measure were from the second and third mammograms in the subgroup of women with at least 3 mammograms. Relative risks from second to third mammogram were normalised so that mean = 1. ‘Time-varying’ means that a woman’s values for breast density and BMI are updated through time, i.e. at each screening examination. Orange line represents the cumulative distribution function for BI-RADS density. Blue line represents the cumulative distribution function for longitudinal density. X-axis on a log scale. BI-RADS Breast Imaging Reporting and Data System, BMI body mass index

