
Fig. 1. Heat map and 2-way hierarchical clustering of miRNA expression in both outcome groups at both time-points.
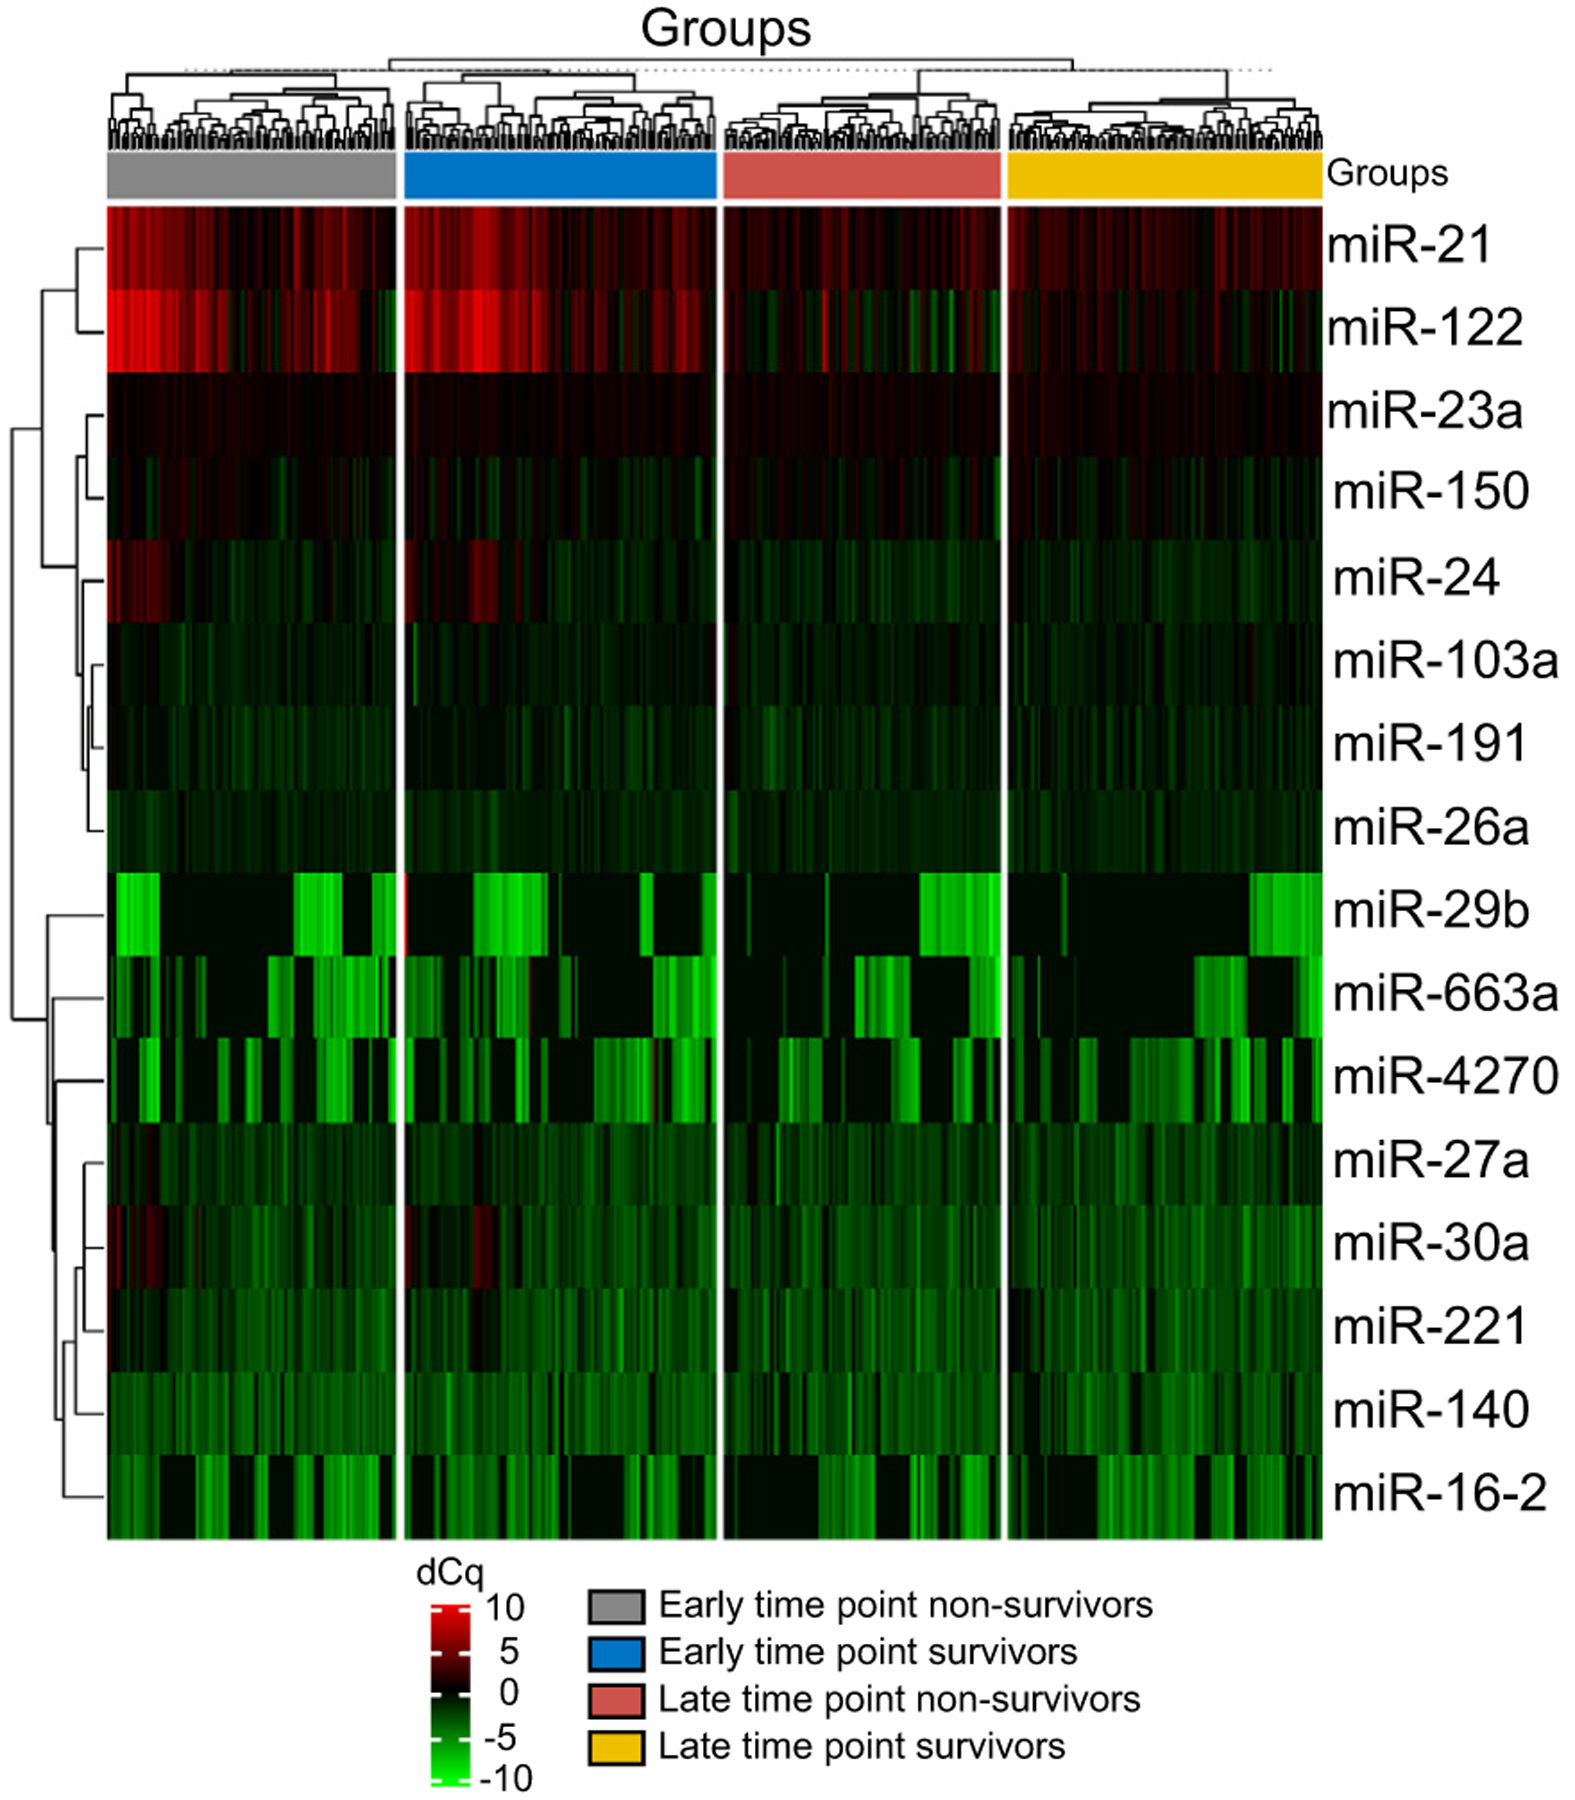
Clustering was performed on all samples and on the top 16 miRNAs with the highest SD using dCq values (miRNA were excluded if not detected in greater than 100 samples). dCq, delta quantification cycle; miR/miRNA, microRNA.