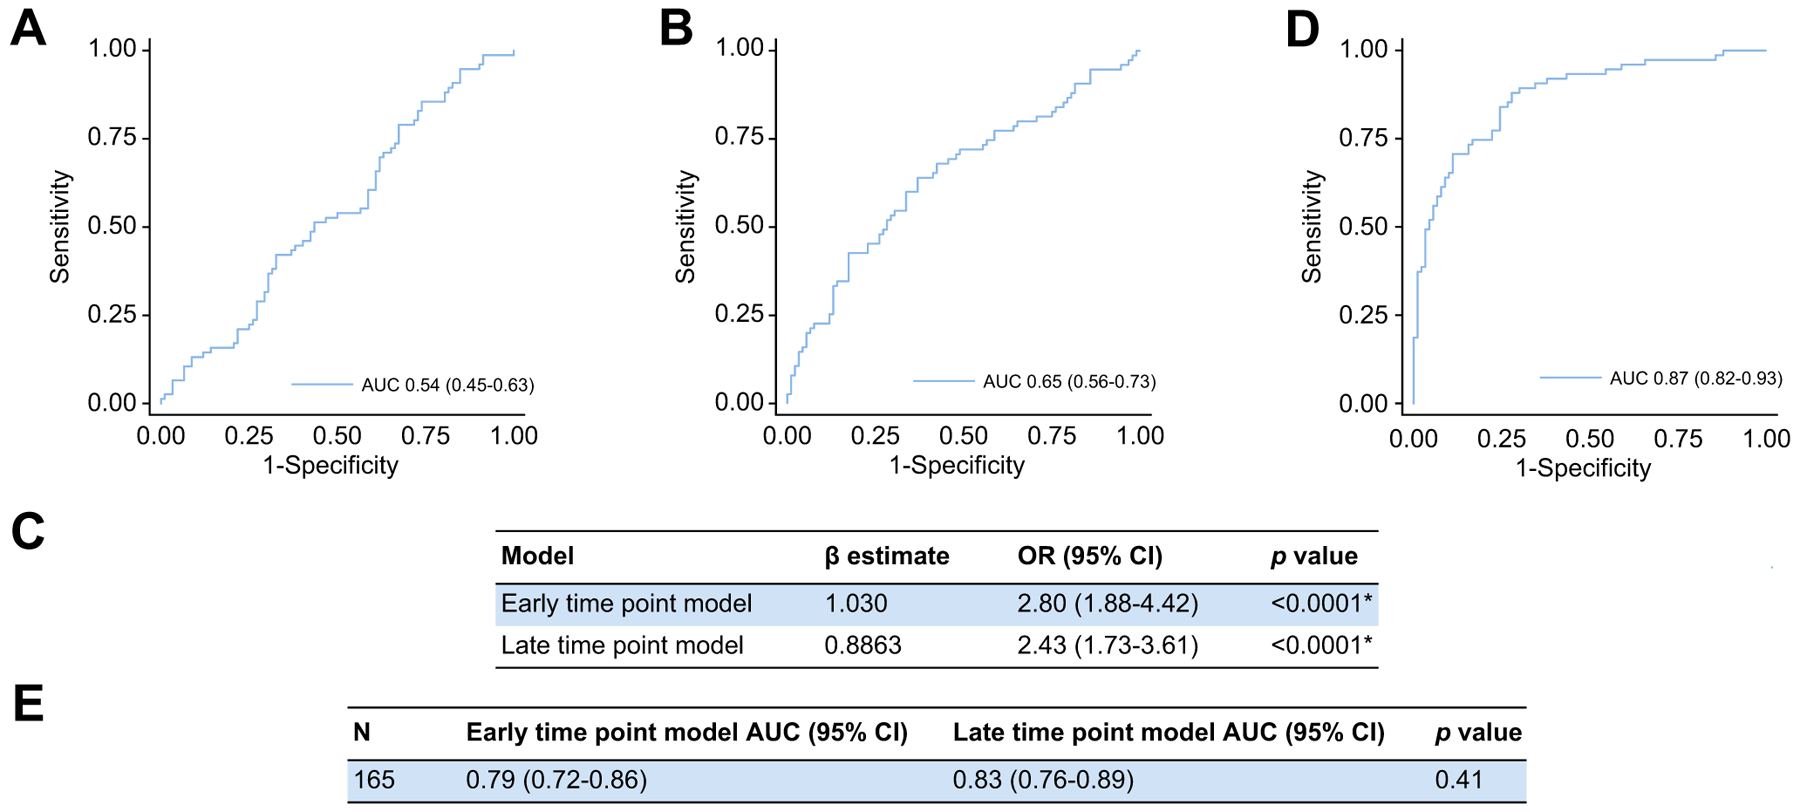
Fig. 4. Comparing the performances of the early and late time-point models.

(A) Performance of the late time-point model at the early time-point (n = 167; AUC 0.54; 95% CI 0.45–0.63; p = 0.40). (B) Performance of the early time-point model at the late time-point (n = 165; AUC 0.65; 95% CI 0.56–0.73; p = 0.001*). (C,D) Combined model performance in patients with paired samples (n = 165; AUC 0.87 [95% CI 0.82–0.93; p <0.0001*]; pseudo r2 = 0.4153, HL statistic 14.37 [p = 0.07]). (E) Comparison of both models’ performances in patients with paired samples using the DeLong method. Statistical significance set as per Benjamini-Hochberg procedure with a false discovery rate of 0.05 (*p <0.026). HL, Hosmer-Lemeshow; OR, odds ratio.
