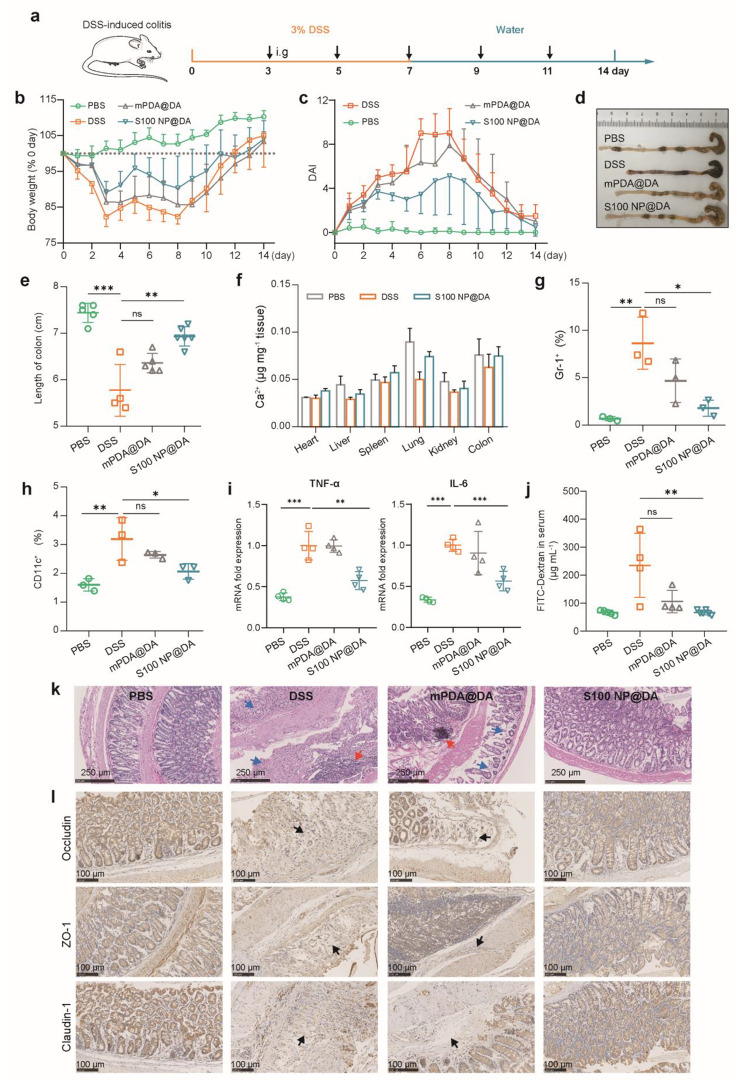
Fig. 5.
Therapeutic efficacy of pathologically catalyzed PDA coating against DSS-colitis. (a) Schematic illustration of colitis induction and treatment. S100 NP@DA was i.g. administered. (b) Changes in body weight (n = 4–6). (c) Disease activity index (DAI) record (n = 4–6). (d) Image showing the colon tissue of each group. (e) Statistical analysis of colon length (n = 4–6). (f) [Ca2+] in major organs and colons (n = 3). (g) The population of neutrophils (Gr-1+) in colon tissue (n = 3). (h) The population of dendritic cells (CD11c+) in colon tissue (n = 3). (i) The mRNA level of TNF-α and IL-6. (j) Intestinal permeability indicated by serum FITC-Dextran (n = 4–6). (k) The histopathological assessment of the colon with H&E staining. Blue arrow: the loss of the epithelial barrier; Red arrow: the infiltration of immune cells. (l) Immunohistochemical staining of Occludin, ZO-1, and Claudin-1 (scale bar: 100 μm). Results were expressed as mean ± SD. *p < 0.05, **p < 0.01, ***p < 0.001; ns represented not significant

