
Fig. 2. Change in ROTEM parameters over time according to underlying etiology of liver injury.
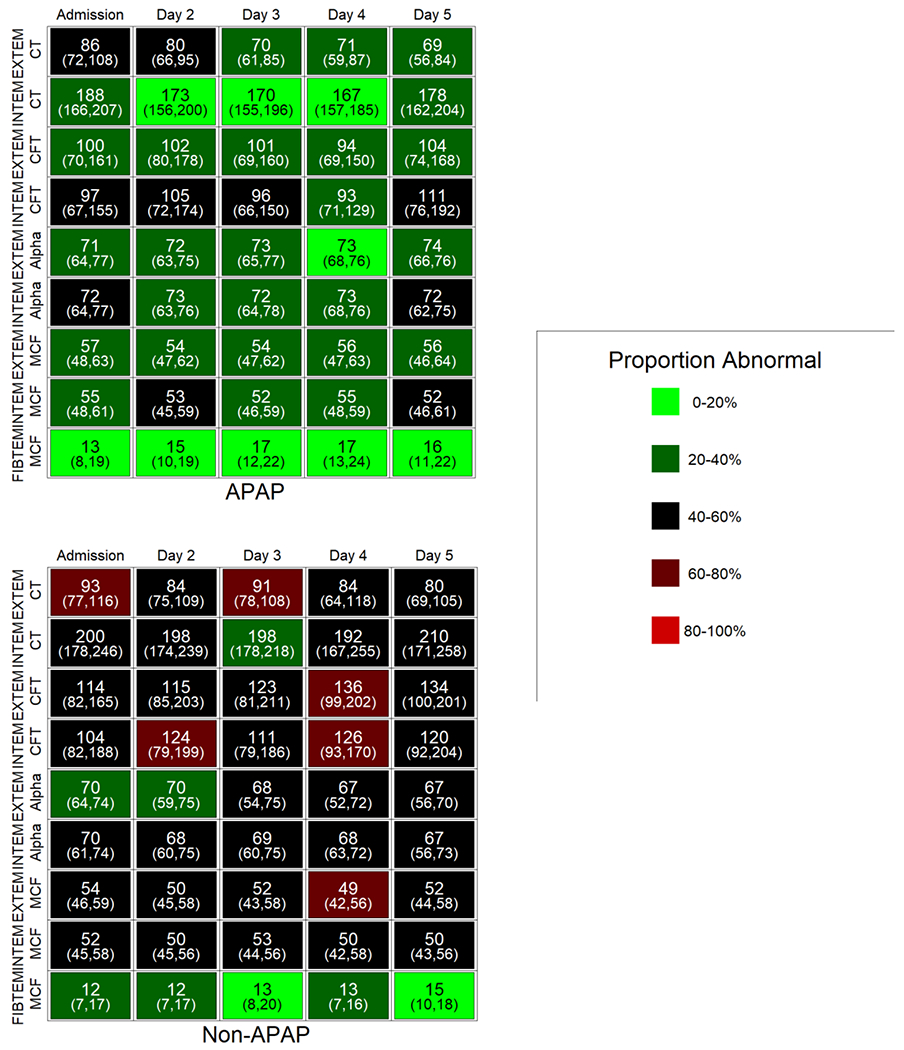
Individual cells display the median and IQR values for the parameter on that day. Shading (light green to red) indicates the increasing proportion of subjects with an abnormal ROTEM parameter for that day compared to reference values. APAP, acetaminophen; non-APAP, non-acetaminophen, CT, clotting time; CFT, clot formation time; alpha, alpha angle; MCF, maximal clot firmness.