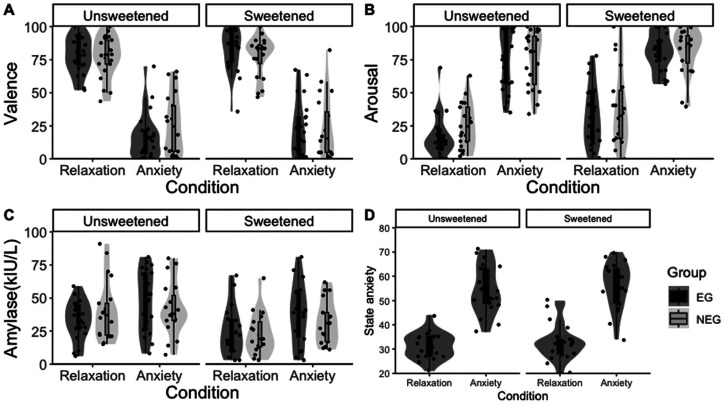
Figure 2.
Violin and box-and-whisker plots for indicators of emotional states in Experiment 1. (A) Subjective valence ratings by emotion condition for each awareness focus group and for each taste stimulus group. (B) Subjective arousal ratings. (C) Activities of saliva α-amylase. (D) State anxiety scores of STAI regarding the EG participants. Comparison of LSMs confirmed significant differences by emotion condition for all indicators.

