
Figure 2.
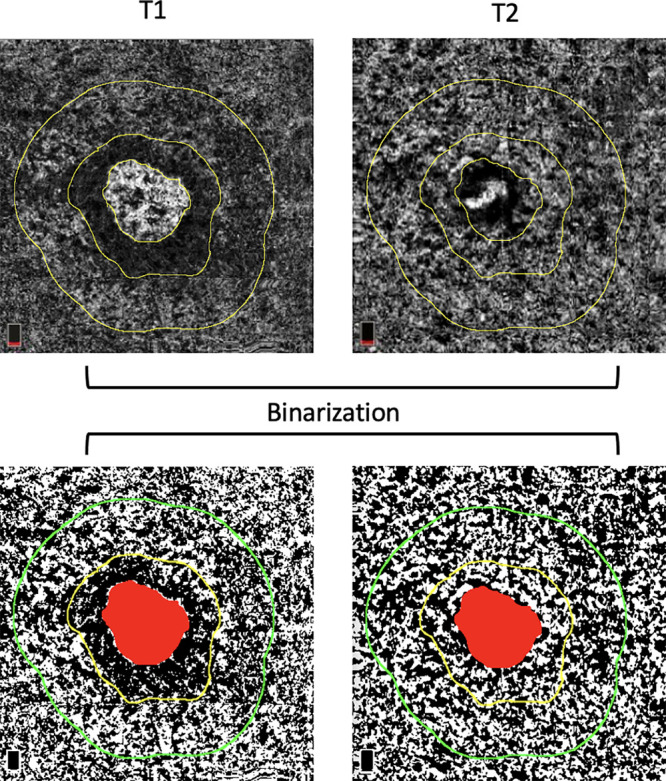
En face CC OCTA images show the borders of the MNV lesion, the related DH and the automated final ring (highlighted in yellow). Afterward, the CC images were binarized for quantitative FDs measurements in the final ring using the Phansalkar method at baseline (T1) and after loading dose of aflibercept (T2). The custom configuration, which is unique for each patient, was applied to the en face CC images at Time 2 using the same size and position of the rings as in T1.