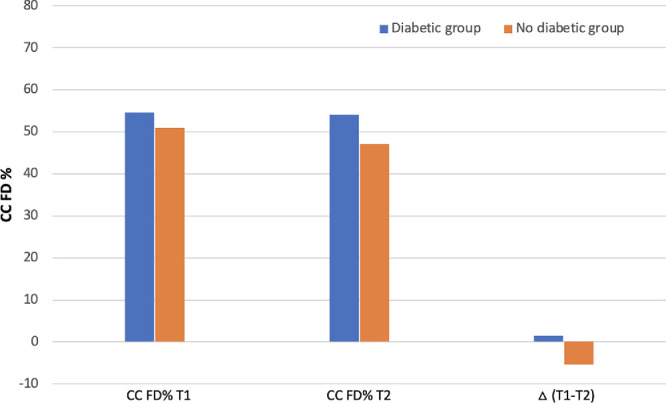
Figure 3.

Sixty-five eyes with a diagnosis of exudative neovascular AMD and type 1 MNV were enrolled, resulting in a group of 35 subjects with no evidence or history of diabetes and in a group of 30 individuals with diabetes and mild NPDR. Results shown represent the Phansalkar local thresholding method analysis. As illustrated in the graph, the percentage (%) of CC FD is statistically significantly greater in the DM group compared with non-DM group in both T1 (P = 0.037) and T2 (P = 0.002). Also, the mean difference of CC FD% between the two groups is statistically significantly. A gradual CC reperfusion resulted in the “non-DM group” after LP of aflibercept compared with DM eyes (P = 0.029).
