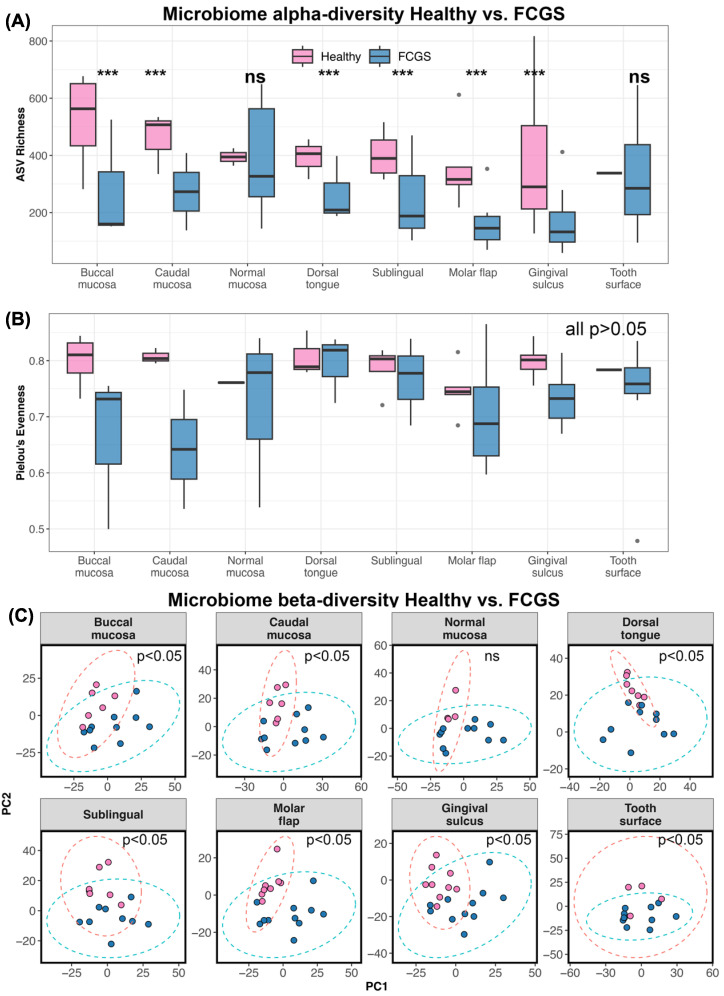
Figure 2.
The oral microbiomes of cats with FCGS are distinct from those of healthy cats. (A) Boxplots of microbiome ASV richness and (B) Pielou’s evenness in plaque samples from eight oral sites, in healthy cats and cats with FCGS. Asterisks *** indicate statistical significance (p = 0.05), ns denotes where difference was not statistically significant. (C) PCA ordinations based on Aitchison distances calculated from bacterial species abundances. PERMANOVA p-values are shown.

