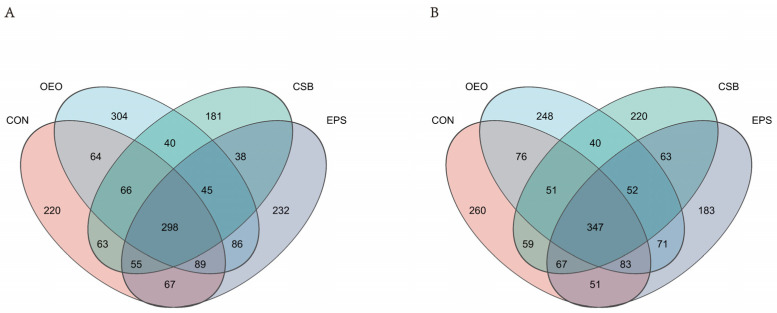
Figure 2.
Venn diagram of the species composition of intestinal micro-organisms in calves. (A) Venn diagram analysis of calves before weaning. (B) Venn diagram analysis of calves before weaning. Different colors represent different groups, overlapping parts represent genus that are common among multiple groups, parts of not overlap represent genus that are specific to the group, and numbers indicate the number of genus corresponding.

