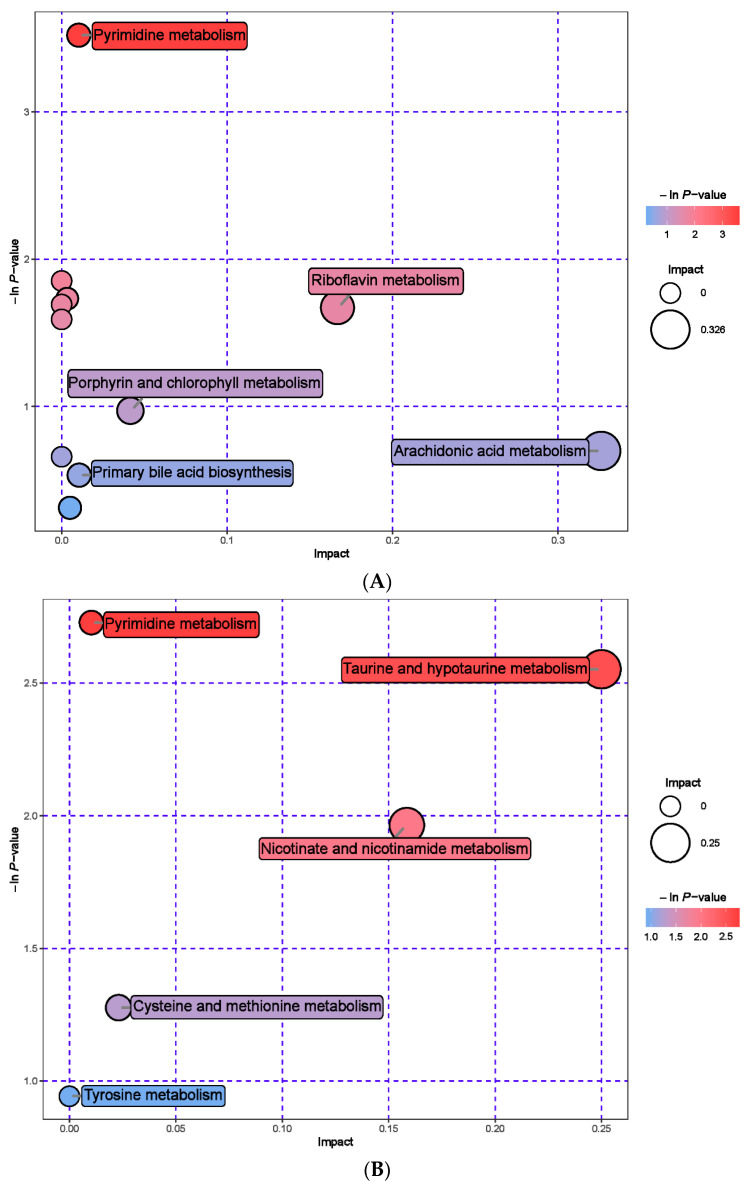
Figure 5.
Pathway analysis of rumen metabolomics in fattening sheep. (A) Pathway analysis of MHB group in cationic mode, (B) pathway analysis of MHB group in anionic mode. Note: The color and size of bubbles indicate the impact of mint treatment on sample metabolism, while larger red bubbles indicate a greater impact on the pathway.

