Figure 12.
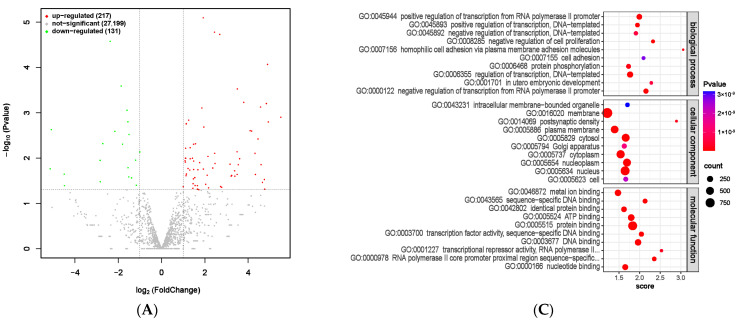
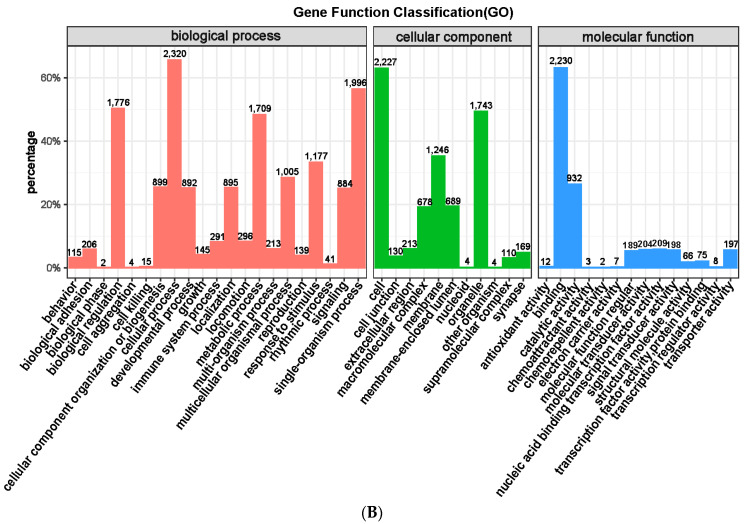
Differential expression analysis of miRNA between MHB group and CON group. (A) Volcano map of miRNA expression differences between MHB group and CON group. (B) MHB group and CON group differentially expressed miRNA GO annotation classification histogram. (C) The functional scatter plot shows a significant difference in miRNA enrichment between the MHB group and the CON group, with a top 10 × 3 degree (biological process, cellular component, and molecular function each with a top 10 degree).


