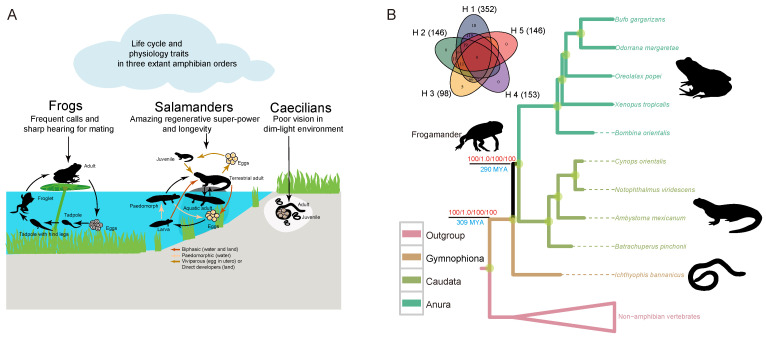
Figure 1.
Physiology traits and phylogenomic analysis of extant amphibians. (A) The most prominent characteristics of frogs, salamanders, and caecilians. (B) Phylogenomic tree. The red numbers on the important nodes represent support values from the maximum likelihood (ML), Bayesian (PB), maximum pseudo-likelihood estimates (MPE), and maximum parsimony “Genes as characters” (GAC) methods. The blue numbers below the branch represent the origin date of the extant amphibians (309 MYA) and the living frogs and salamanders (290 MYA). Upper left is a Venn diagram of gene clusters supporting the different phylogenetic hypotheses, as shown in Figure S1. The numbers in brackets represent the quantity of genes that cannot reject a specific hypothesis.

