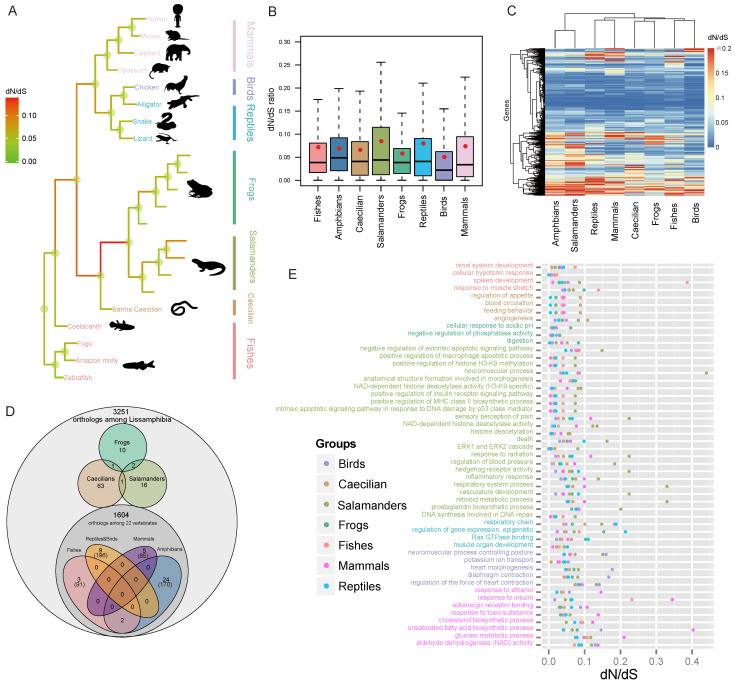
Figure 2.
Accelerated rate of adaptive evolution in salamanders. (A) dN/dS ratio tree of 22 vertebrates shows that salamanders have a higher dN/dS ratio than any other vertebrate group. (B) The boxplot of dN/dS ratios for all genes in each major vertebrate group, which shows that salamanders have a much higher mean dN/dS ratio than any other group (p ≤ 0.025 for all pairwise tests). (C) The clustered heatmap of dN/dS ratios of major vertebrate groups also shows that salamanders are distantly related to other vertebrate groups in terms of dN/dS ratio. (D) Venn diagram showing number of PSGs and FEGs (in brackets) in Lissamphibia and other vertebrates. (E) The rapidly evolving GO categories (REGOs) in Lissamphibia and other vertebrates show that salamanders have a significantly higher number of REGOs than any other vertebrate group.

