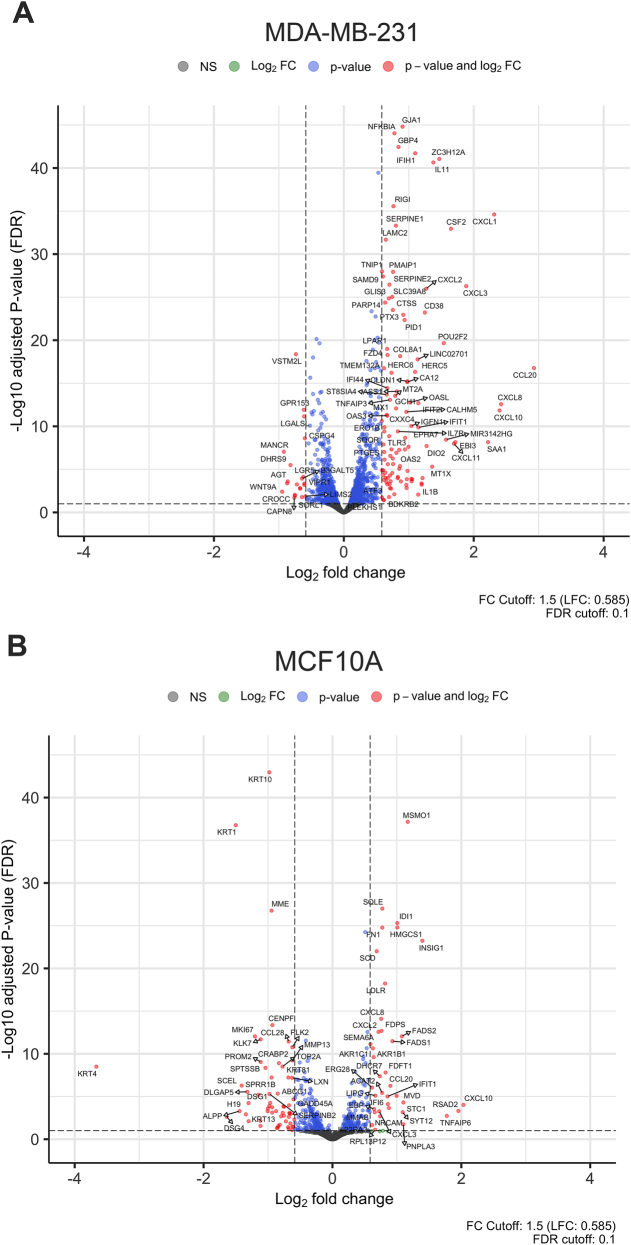
Fig. 2.
Dispersion patterns of differentially expressed genes (DEGs): (A) Volcano plot of DEGs in MDA-MB 231 cell line. (B) Volcano plot of DEGs in MCF10A cell line. The x-axis represents the log2 fold change and the y-axis represents the negative log10 of the adjusted P-value. The cutoff criteria were the adjusted P-value ≤0.10 and absolute log2 fold change greater than +1.5 and less than −1.5. Points in red represent genes that exceed both cutoff criteria

