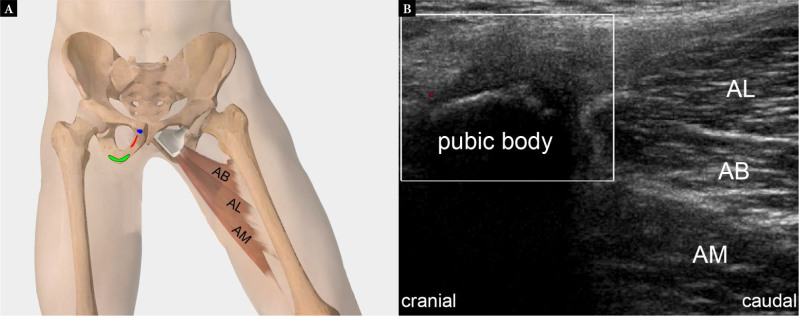
Fig. 24.
Graphic illustration (A) demonstrates the osseous footprints and normal transducer position for assessing the adductor tendons (AB – adductor brevis, footprint highlighted in red; AL – adductor longus, footprint highlighted in blue; AM – adductor magnus, footprint highlighted in green). Long-axis US image (B) shows the normal sonographic appearance of the same muscles

