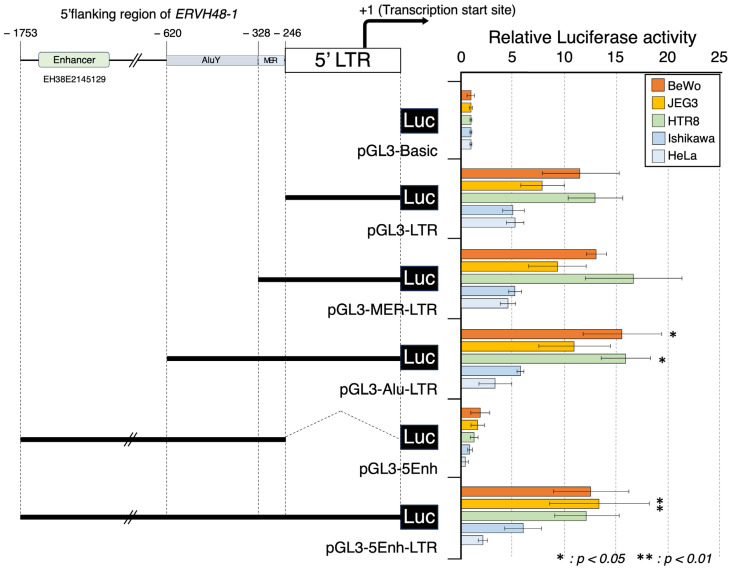
Figure 2.
Promoter activity of the suppressyn 5′ LTR and its flanking region. On the left is a schematic diagram of the suppressyn 5′ LTR and 5′ flanking sequence, as cloned into the pGL3 vector. The enhancer region predicted by the cCRE is shown schematically (EH38E2145129). The right side of the diagram depicts the results of luciferase activities measured after the transfection of these constructs into various cell lines (BeWo, JEG3, HTR8, Ishikawa, and HeLa cells). pGL3-basic was used as reference for comparison to each of the other constructs. Statistical analyses were made using Mann–Whitney U tests compared to pGL3-LTR in each cell line (* p < 0.05, ** p < 0.01). Experiments were performed in duplicate, and the means and ± SDs were calculated from three independent experiments.

