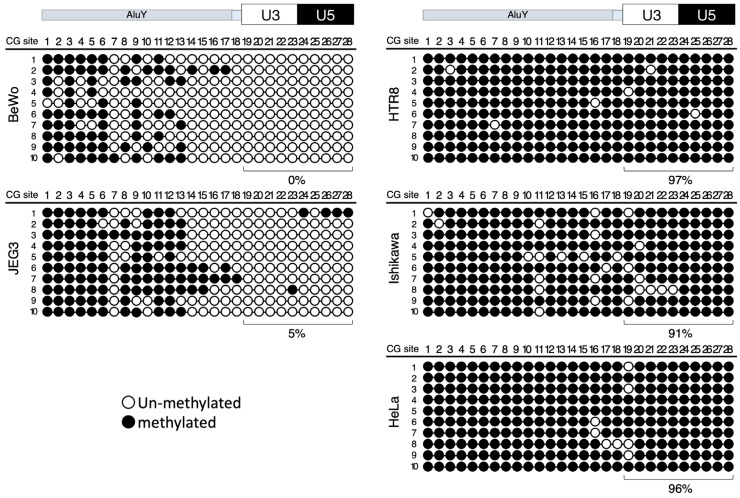
Figure 3.
Bisulfite sequencing analysis of ERVH48-1 promoter regions. Bisulfite sequencing of the ERVH48-1 5′ LTR and 5′ flanking region. White circles represent non-methylated CpG sites and black circles represent methylated CpG sites. The top columns show the location of CpG dinucleotides from 1 to 28, with numbers 19–28 depicting the methylation status of CpG sites within the 5′ LTR region. The bottom columns list the methylation rates (%) for each 5′ LTR region.

