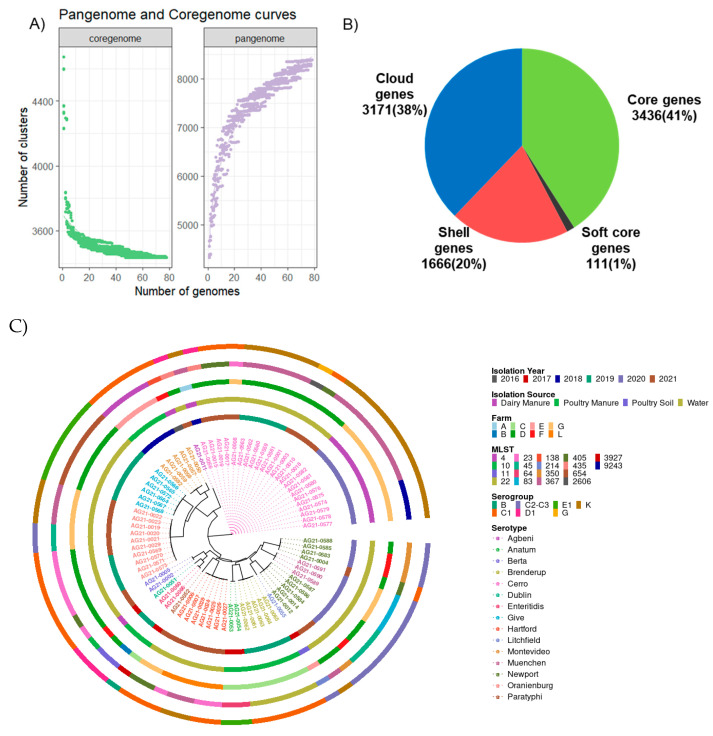
Figure 1.
(A) Rarefaction curves for core (3436) and pan-genes (8384) of the 78 isolates. The x-axis represents the number of genomes. (B) Pie chart showing the pan-genome composition of the isolates. Core genes are present in 100% of isolates, with soft-core genes in 95–99%, shell genes in 15–99%, and cloud genes in <15% of isolates. (C) Whole-genome core SNP-based phylogeny of Salmonella enterica isolates (n = 78), with samples (tips) colored by serotype. Each isolate is color-coded differently in five different circles based on the isolation year, isolation source, farm type, MLST, and serogroup.

