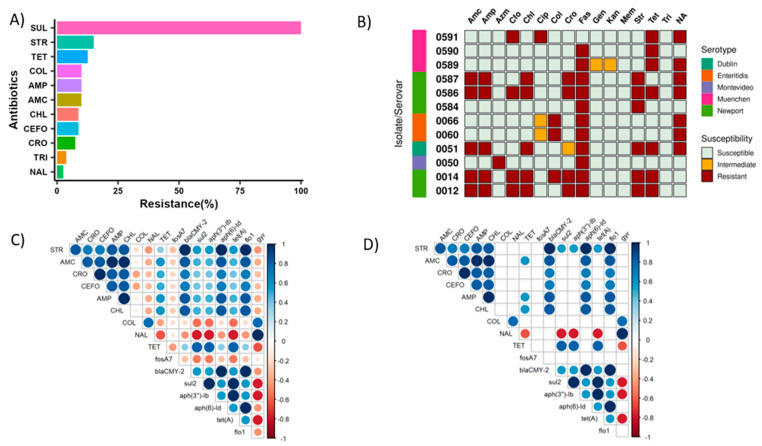
Figure 3.
(A) Summary of overall resistance percentages of Salmonella isolates (n = 80) to 16 different types of antibiotics determined by broth microdilution method. The data shown in the bar graph are averages across two independent experiments. The minimum inhibitory concentrations (MICs) of the antibiotics (μg/mL) tested were as follows: streptomycin (STR: 32–64), kanamycin (KAN: 16–64), gentamycin (GEN: 4–16), amoxicillin (AMC: 8–32), ceftriaxone (CRO: 1–4), cefoxitin (CEFO: 8–32), sulfisoxazole (SUL: 256–512), trimethoprim-sulfamethoxazole (TRI: 2–4), azithromycin (AZM: 16–32), meropenem (MEM: 1–4), ampicillin (AMP: 8–32), chloramphenicol (CHL: 8–32), colistin (COL: 2–2), ciprofloxacin (CIP: 0.06–1), nalidixic acid (NAL: 16–32), and tetracycline (TET: 4–16). (B) Phenotypic AST results of the isolates possessing AMR genes. (C,D) Correlation matrix of phenotypic (antibiotic resistance) and genotypic (antibiotic resistance genes) features showing all correlations (C) and significant (p < 0.05) correlations (D). Circles are only shown for significant correlations (D), where circle size indicates the strength of the correlation, and circle color indicates the sign of the correlation: blue circles indicate a positive correlation, and red ones represent a negative correlation. Antibiotics (phenotypic resistance) are listed first with capitalized names, and ARGs (genotypic resistance) are listed next and have all-lowercase names.

