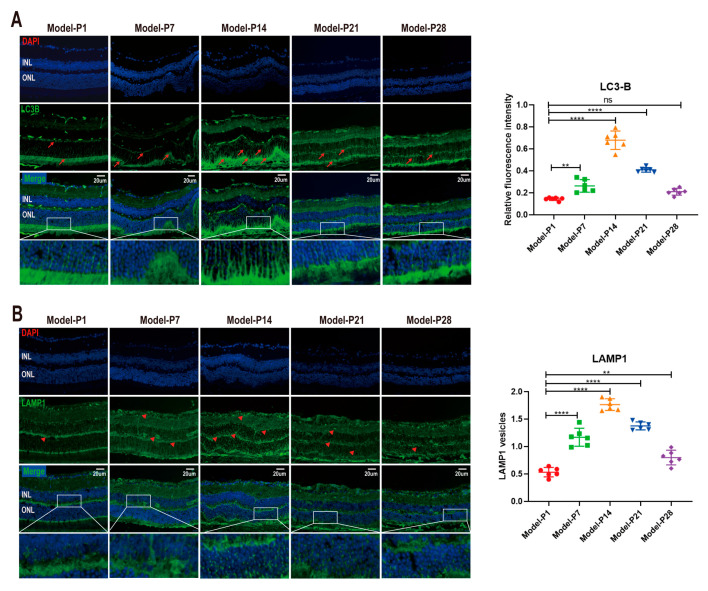
Figure 3.
(A) LC3-B immunoreactivity in the retina sections of RD model. The LC3-B (green) staining was extremely faint at P1. However, LC3-B immunoreactivity increased at P7, as evidenced by the clusters of strongly stained small particles. Subsequently, at P14, the LC3-B immunostaining decreased over time. (B) The red arrows represent positive cells. The LAMP1-positive organelles in RD models were enlarged and looped at P7. The intensity of LAMP1-positive immunostaining peaked at P14 and then decreased progressively until P28. The red triangles represent positive cells (one-way ANOVA multiple comparisons were analyzed; ns, ** p < 0.01, **** p < 0.0001 for differences compared with P1; n = 6).

