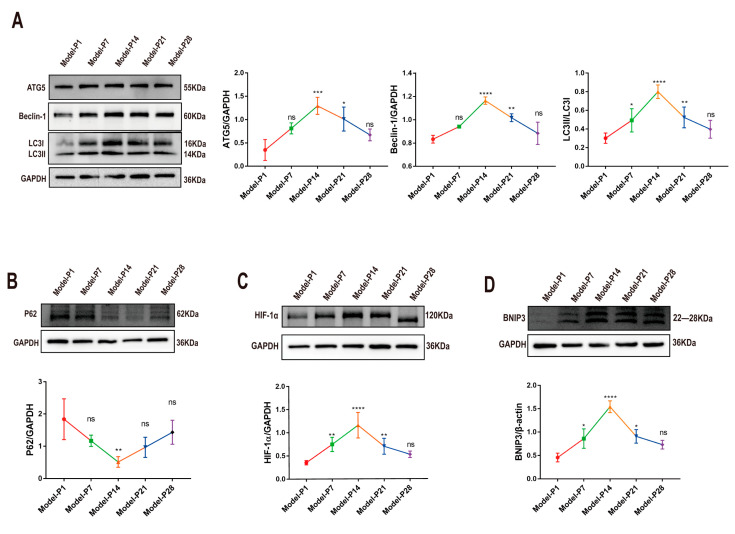
Figure 4.
Expression levels of autophagy-related proteins in RD model. (A) Representative Western blot images of ATG5, Beclin-1, and LC3-B, and statistical line chart of gray value. (B) Representative Western blot images of P62 and statistical line chart of gray value. (C,D) Representative Western blot images of HIF-1α and BNIP3, and statistical line chart of gray value (one-way ANOVA multiple comparisons were analyzed; ns, * p < 0.05, ** p < 0.01, *** p < 0.001, **** p < 0.0001 for differences compared with P1; n = 6).

