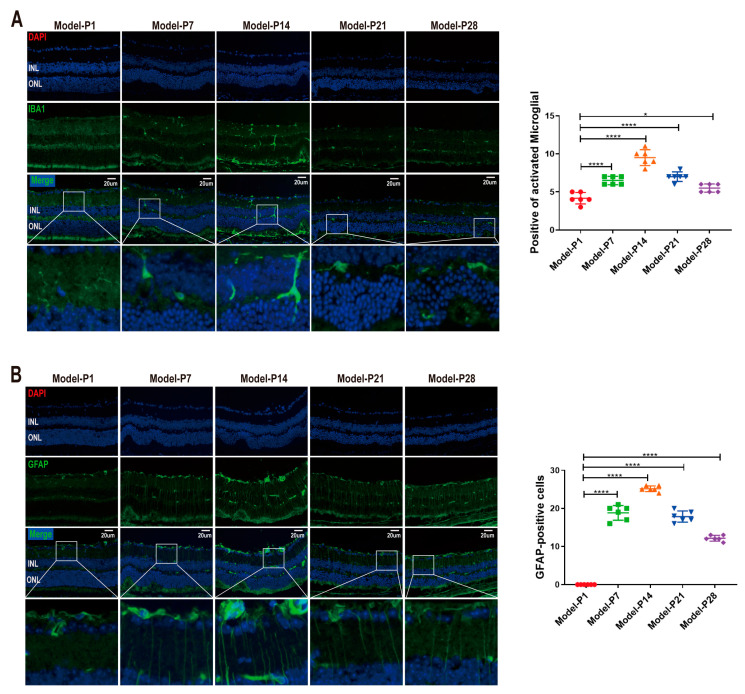
Figure 5.
Activation of microglia and Müller cells in RD model. (A) The immunostaining intensity of IBA1 increased at the onset of RD. IBA1-positive cells were distributed in the inner nuclear layer with multi-branched shape. The activated microglia migrated into ONL at P14. (B) The GFAP expression was located exclusively at the feet of the ganglion cell layer (GCL) to form the inner limiting membrane (ILM) at P1. At P7, the distribution of GFAP immunostaining expanded to ONL. The number of GFAP-positive cells then decreased gradually until P28 (one-way ANOVA multiple comparisons were analyzed; * p < 0.05, **** p < 0.0001 for differences compared with P1; n = 6).

