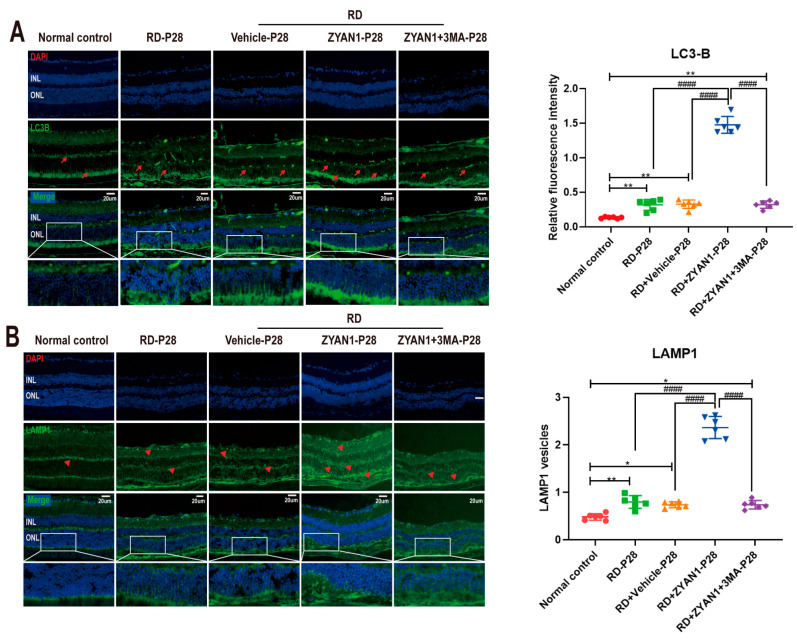
Figure 11.
ZYAN1 enhanced the positive signal of LC3B and LAMP1 in RD models at P28. (A) Strong LC3-B spots were found in INL and ONL. Red arrows indicate positive cells. (B) Compared with RD model, more LAMP1-positive cells were detected in the retinas of RD + ZYAN1 group. Red triangle indicates positive cells (* p < 0.05, ** p < 0.01 for differences compared with normal control group; #### p < 0.0001 for differences compared with RD + ZYAN1 group, n = 6).

