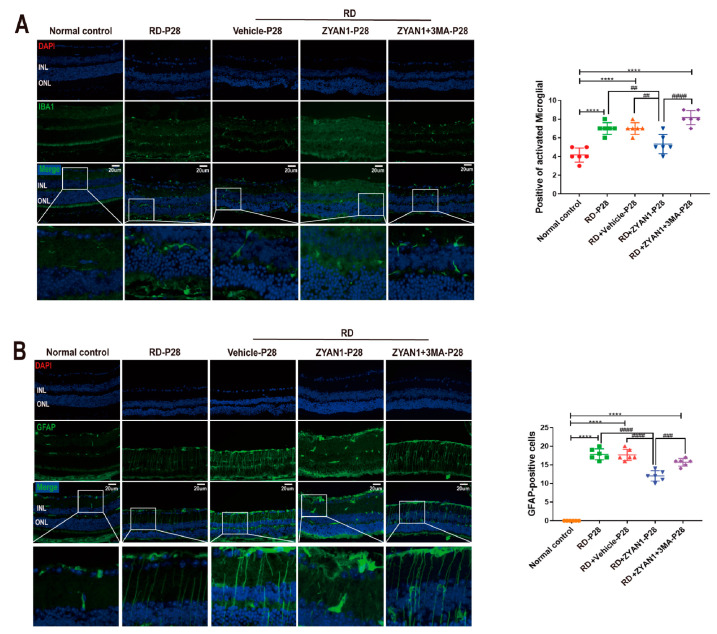
Figure 13.
ZYAN1 inhibited the Müller and microglia activation in RD model at P28. (A) The number of IBA1-positive cells in RD+ZYA1N group reduced significantly compared with that in RD group. (B) The intensity of GFAP immunostaining in the RD + ZYAN1 group decreased compared with that in the RD group (**** p < 0.0001 for differences compared with normal control group; ## p < 0.01, ### p < 0.001, #### p < 0.0001 for differences compared with RD + ZYAN1 group, n = 6).

