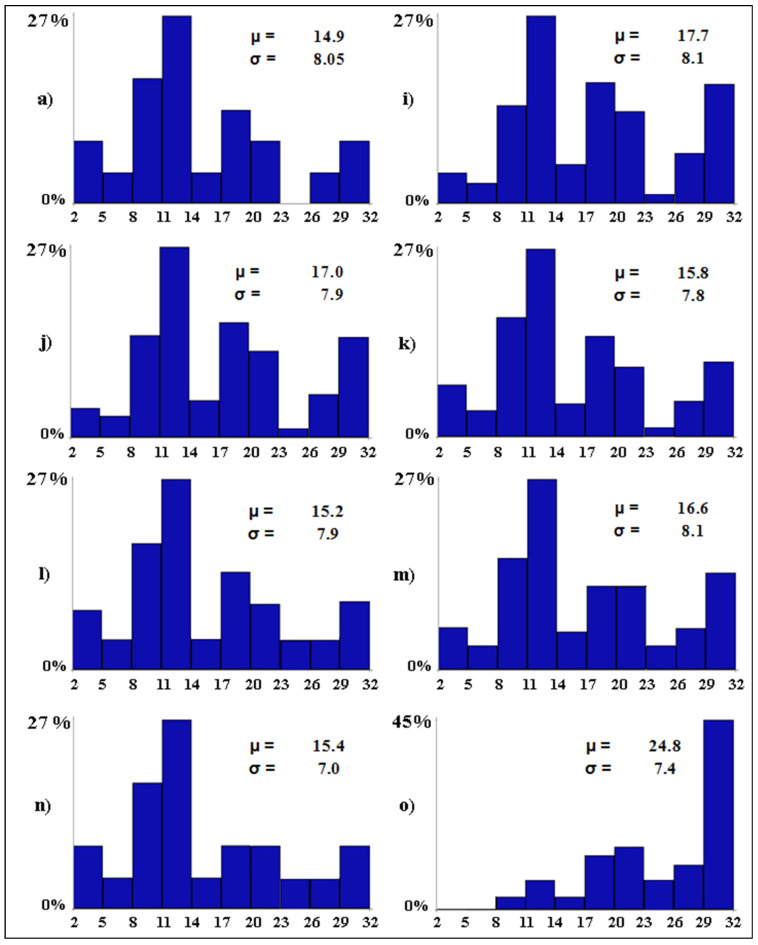
Figure 6.
Baseline (a) and best-case (i–o) scenarios. The letters associated with the scenarios have the same meaning as per Table 2. On the x-axis, the expected distribution of the avian diversity (expressed as number of bird species in 10 equal-size intervals) is reported. On the y-axis, the proportion (in %) of wetlands that are expected to fall into each range of avian diversity is shown. For each scenario, the Greek letters indicate the mean (µ, i.e., alpha diversity) and standard deviation (σ) of the expected number of bird species per wetland.

