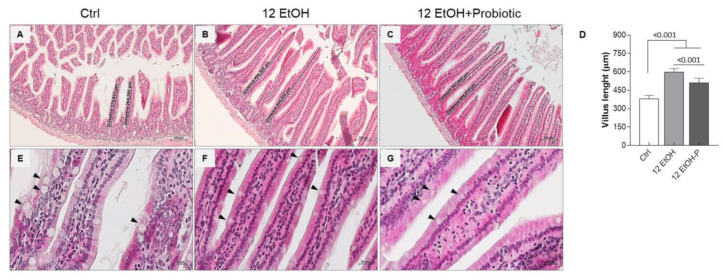
Figure 2.
Morphological features of the mice jejunum. Representative images ((A), Ctrl; (B), 12 EtOH; (C), 12 EtOH + Probiotic) and histograms (D) of the H&E stain showing significant differences in the length of villi between the groups. Scale bar 100 µm. Data are presented as mean ± SD. Representative images of H&E stain displaying goblet cells (black arrows) distribution in the jejunum of Ctrl (E), 12 EtOH (F), and 12 EtOH + Probiotic (G) mice. Scale bar 20 µm. Ctrl: control, standard diet; 12 EtOH: 12 weeks of ethanol in the standard diet; 12 EtOH + Probiotic: 12 weeks of ethanol plus L. fermentum LF31 in the standard diet.

