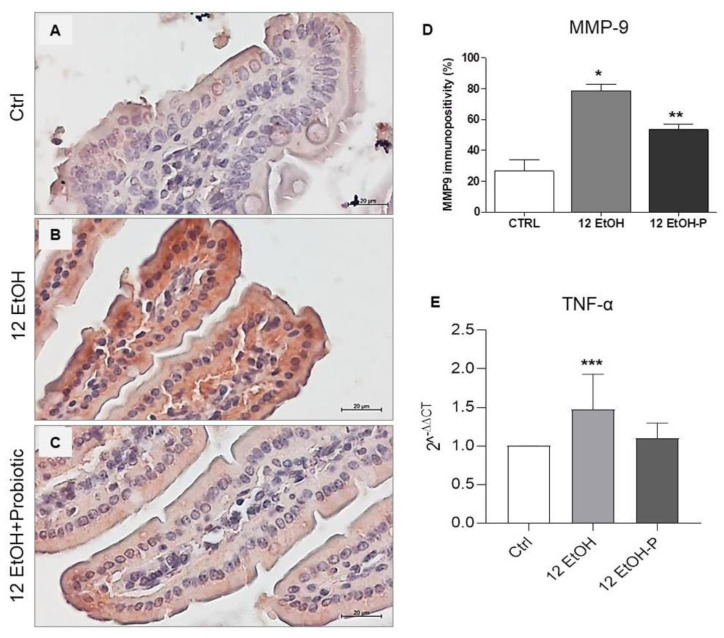
Figure 5.
(A) Representative images of MMP−9 distribution in the jejunim of Ctrl (A), 12 EtOH (B), and 12 EtOH + Probiotic (C) mice. Magnification 400×, scale bar 20 µm. (D) Histograms showing the percentage of immunopositivity for MMP−9. Data are presented as mean ± SD. * Significantly different from Ctrl and 12 EtOH + Probiotic (p < 0.001); ** significantly different from Ctrl and 12 EtOH (p < 0.001). (E) Histograms showing TNF-α gene expression level. The bars indicate the degree of the cytokine gene expression level normalized for the reference genes, according to the Livak method (2−ΔΔCT). The ratio of pro-inflammatory cytokines levels/GAPDH levels was used as an indirect indication of TNF-α decrease. Data are presented as mean ± SD. *** Significantly different from Ctrl (p < 0.03). Ctrl: control, standard diet; 12 EtOH: 12 weeks of ethanol in the standard diet; 12 EtOH + Probiotic: 12 weeks of ethanol plus L. fermentum LF31 in the standard diet.

