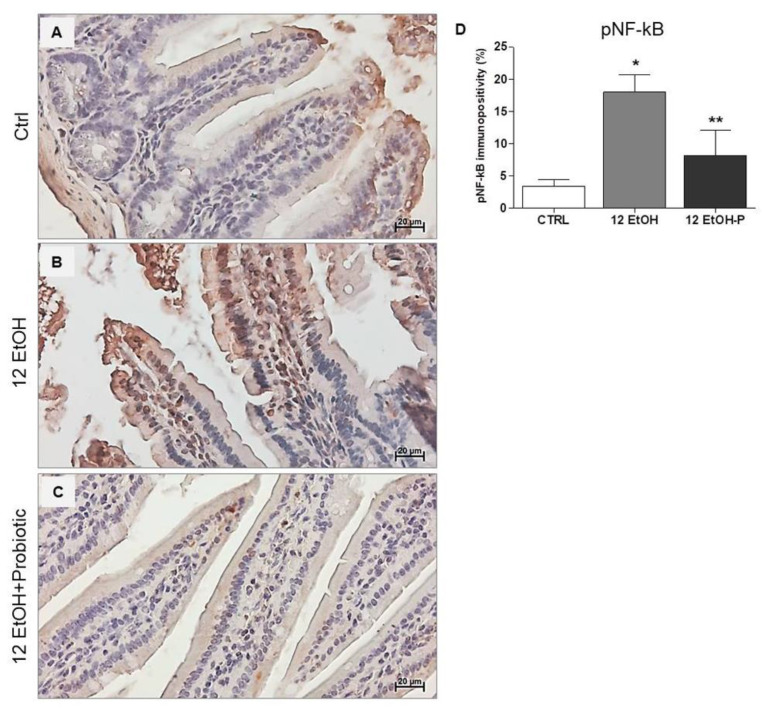
Figure 6.
Immunohistochemical results for pNF-kB. Representative images of pNF-κB distribution in the jejunum of Ctrl (A), 12 EtOH (B), and 12 EtOH + Probiotic (C) mice. Magnification 400×, scale bar 20 µm. (D) Histograms showing the percentage of immunopositivity for pNF-κB. Data are presented as mean ± SD. Ctrl: control, standard diet; 12 EtOH: 12 weeks of ethanol in the standard diet; 12 EtOH + Probiotic: 12 weeks of ethanol plus L. fermentum LF31 in the standard diet. * Significantly different from Ctrl and 12 EtOH + Probiotic (p < 0.001); ** significantly different from Ctrl and 12 EtOH (p < 0.05).

