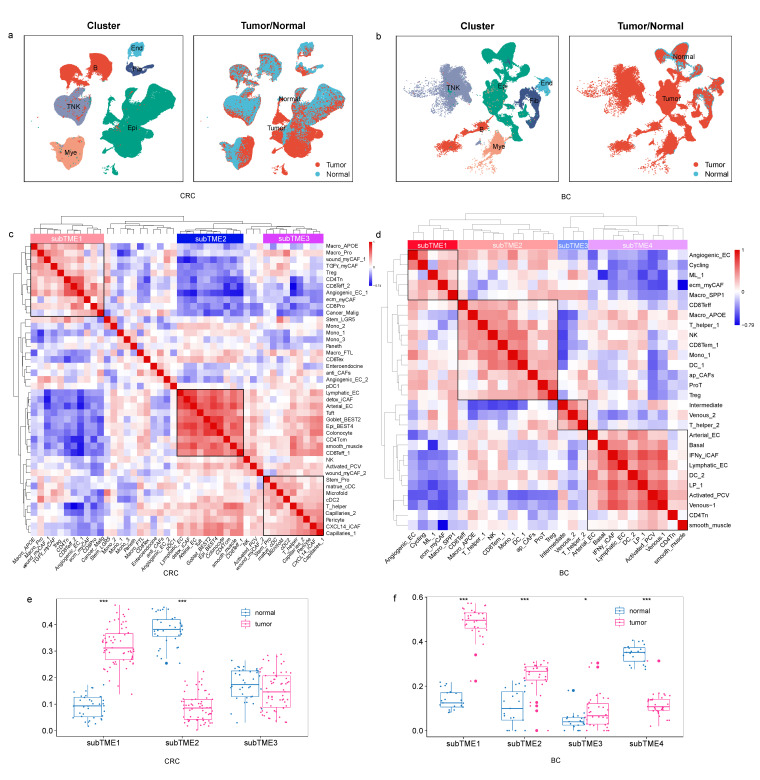
Figure 1.
TME subtypes across cancers. (a) UMAP plots of cells from normal and tumor tissue of CRC patients, showing 6 clusters indicating major cell types and 2 clusters indicating cells derived from tumor and normal tissues. Each cluster is shown in a different color. (b) The same as shown in a but in BC patients. (c) The three cellular modules on the basis of correlations of cell subclusters from tumors with positive (Spearman correlation; correlation coefficient r > 0.3 and FDR < 0.05, in red), negative (r < −0.3 and FDR < 0.05, in blue), or non-significant (white) pairwise correlation for infiltration in CRC samples. (d) The four cellular modules on the basis of correlations of cell subclusters from tumors in BC samples. (e,f) subTME score in normal and tumor sample groups in CRC and BC. *** p < 0.001, * p < 0.05, Wilcoxon tests.

