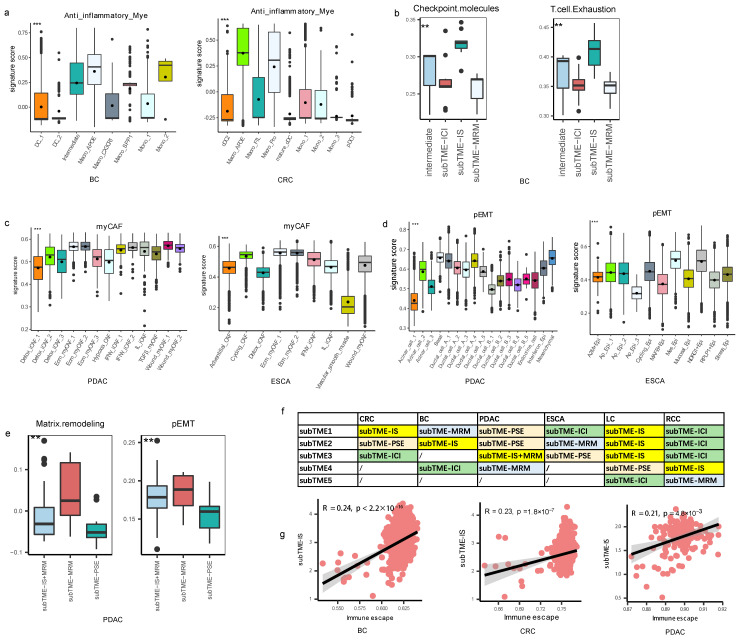
Figure 2.
Definition of TME subtypes. (a) Boxplot showing the anti-inflammatory score among myeloid cells in BC and CRC samples. *** p < 0.001, Kruskal–Wallis test. (b) Boxplot showing the checkpoint molecules and T-cell exhaustion score among subTMEs in BC. ** p < 0.01, Kruskal–Wallis test. (c) Boxplot showing the myCAF score among fibroblasts in PDAC and ESCA samples. *** p < 0.001, Kruskal–Wallis test. (d) Boxplot showing the pEMT score among epithelial cells in PDAC and ESCA samples. *** p < 0.001, Kruskal–Wallis test. (e) Boxplot showing the matrix remodeling and EMT score among subTMEs in PDAC. ** p < 0.01, Kruskal–Wallis test. (f) Definitions of the TME subtypes across cancers. (g) Scatterplot showing the Spearman correlation between immune escape score and subTME-IS score in BC, CRC, and PDAC, the error band indicates 95% confidence interval.

