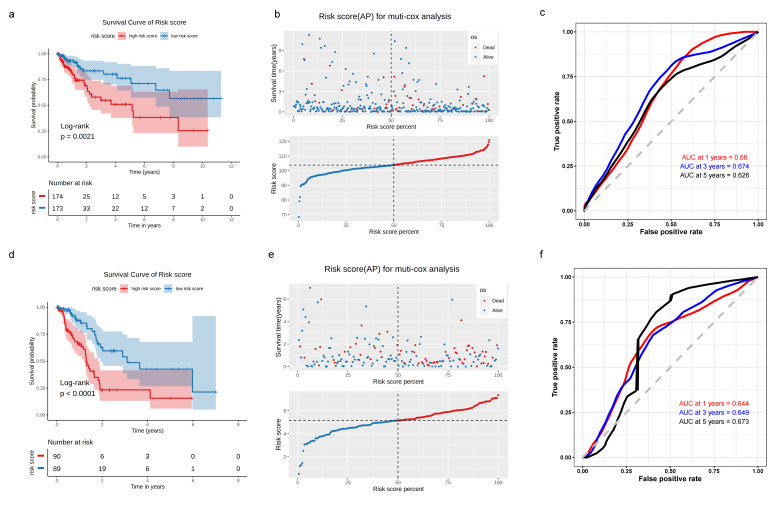
Figure 3.
KM survival analysis, risk score assessment using the subTME gene markers, and time-dependent ROC curves in CRC and PDAC datasets. (a) KM survival analysis of high- and low-risk samples. (b) Relationship between the survival status/risk score rank and survival time/risk score rank. (c) Time-dependent ROC curve for overall survival of the CRC datasets. (d–f) The same as in (a–c) but in PDAC datasets.

