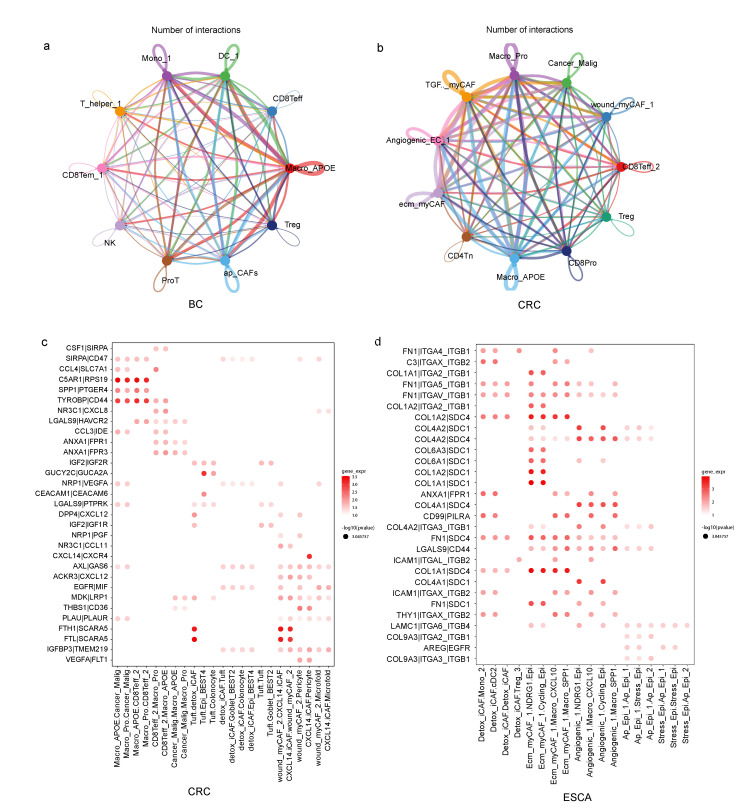
Figure 4.
Cell-cell interaction across cell subclusters within TME subtypes. (a) Social graph depicting the number of interactions between cell types within subTME-IS in BC. (b) Social graph depicting the number of interactions between cell types within subTME-IS in CRC. (c) Enrichment of selected ligand-receptor interactions in CRC for the cell-type pairs within subTME-IS. (d) Enrichment of selected ligand–receptor interactions in ESCA for the cell-type pairs within subTME-MRM. The bubbles shown in the figure indicate p < 0.05; the color of the bubbles indicates the level of mean gene expression of ligand–receptor.

