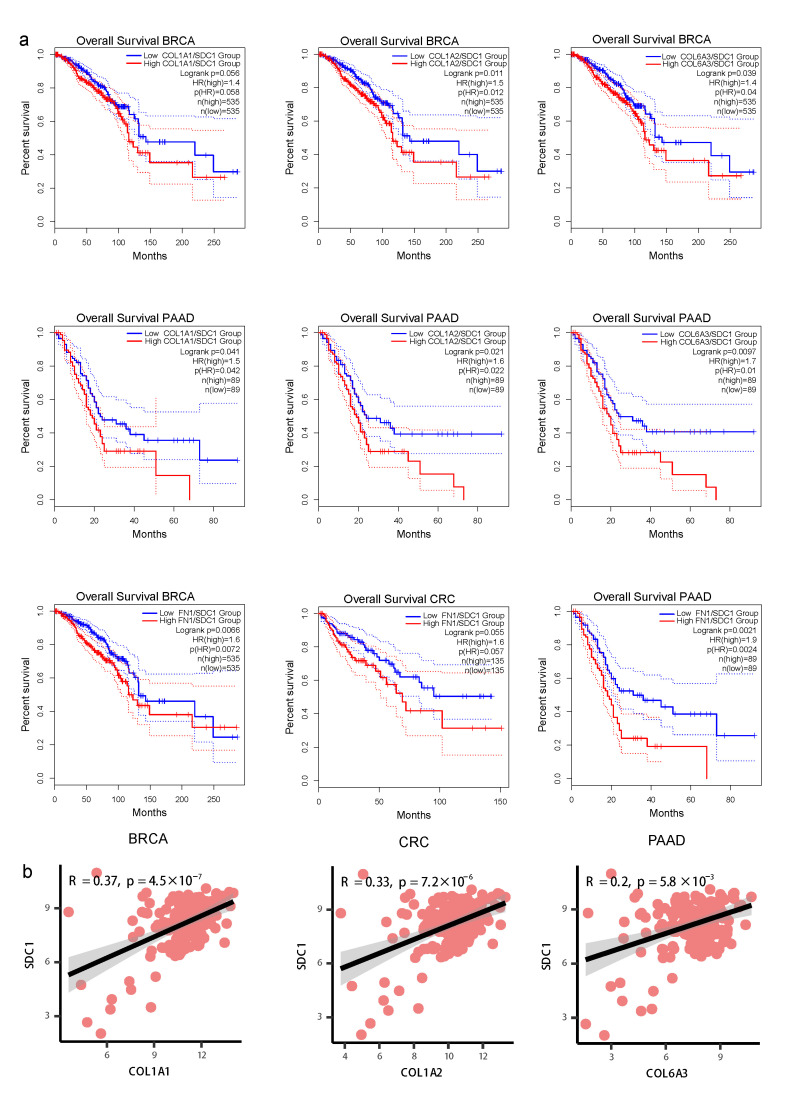
Figure 6.
Clinical prognosis of ligand–receptor interactions between fibroblasts and tumor cells. (a) The Kaplan–Meier curve shows overall survival of COL1A1-SDC1, COL1A2-SDC1, and COL6A3-SDC1 in BC and PDAC patients. (b) Scatterplot showing the Spearman correlation of the gene expression in TCGA-PDAC tumor data, the error band indicates 95% confidence interval.

