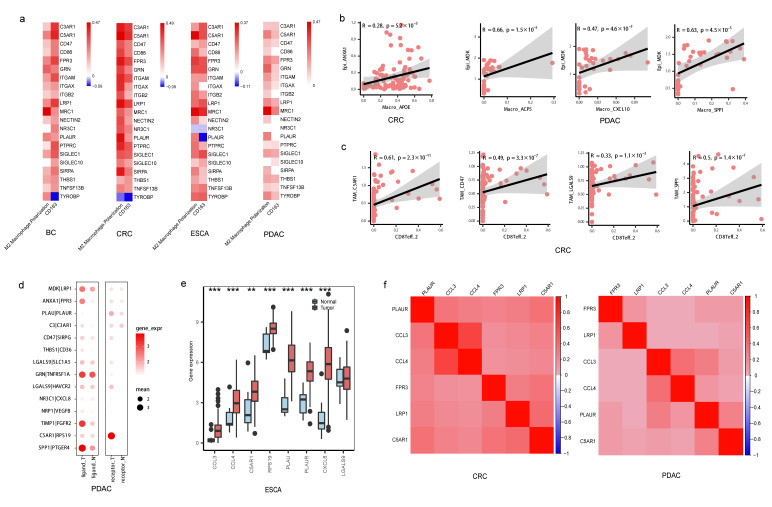
Figure 7.
Immunosuppressive microenvironment regulated by TAMs. (a) Heatmap showing the Spearman correlation between gene expression and M2-like macrophage polarization score as well as CD163 expression in macrophages; color in red indicating positive (Spearman correlation; FDR < 0.05), color in blue indicating negative (FDR < 0.05), color in white indicating non-significant (FDR > 0.05). (b) Scatterplot showing the Spearman correlation of the gene expression in tumor cells and cell proportion of TAMs in CRC and PDAC, the error band indicates 95% confidence interval (c) Scatterplot showing the Spearman correlation of the gene expression in TAMs and cell proportion of CD8+ T cells in CRC, the error band indicates 95% confidence interval. (d) Bubble chart showing the gene expression of ligand–receptor pairs derived from tumor cells and TAMs or TAMs and CD8+ T cells, respectively, between normal and tumor samples in single-cell data in PDAC; the color of the bubbles indicates the level of gene expression of a ligand or receptor in sender or receiver cells; the bubbles shown in the figure indicate p < 0.05, Wilcoxon tests. (e) Boxplot showing the gene expression of ligand–receptor pairs between normal and tumor samples in TCGA-ESCA data, *** p < 0.001, ** p < 0.01, Wilcoxon tests. (f) Heatmap showing the Spearman correlation between gene expression levels in TAMs in CRC and PDAC, p < 0.05.

