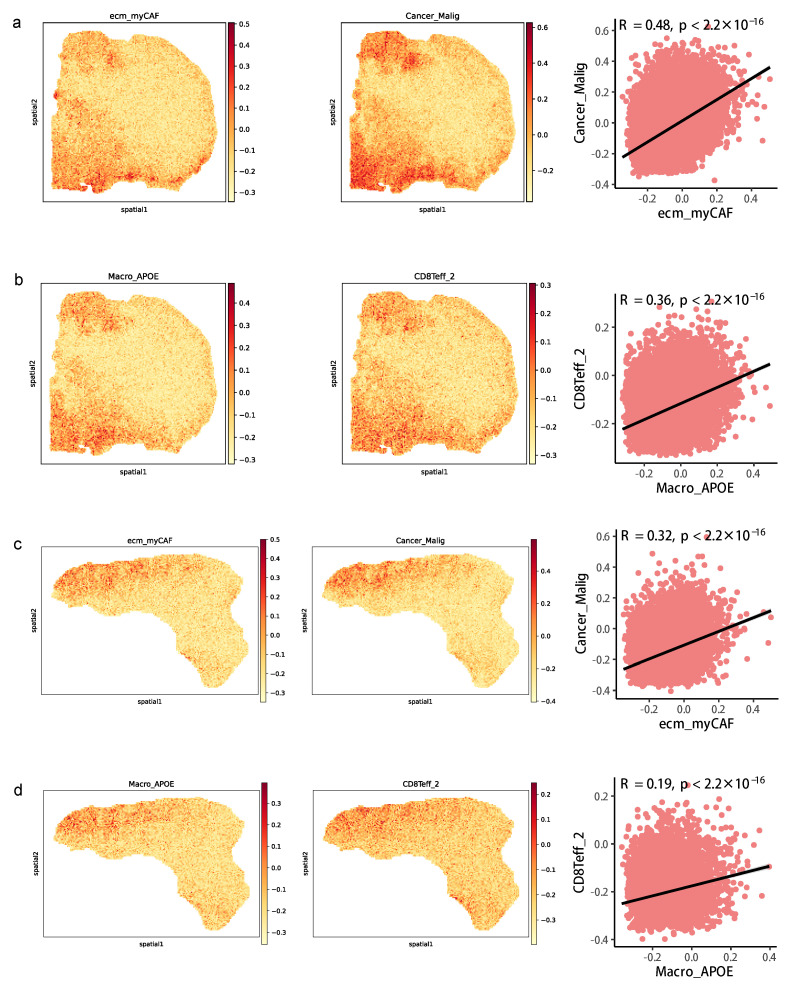
Figure 8.
Co-localization of cell types in spatial transcriptomics data. (a) Spatial feature plots of signature score of ecm_myCAF (left) and Cancer_Malig (middle) in tissue sections and Spearman correlation of signature score of ecm_myCAF and Cancer_Malig (right) in CRC patient #19. (b) Spatial feature plots of signature score of Macro_APOE (left) and CD8Teff_2 (middle) in tissue sections and Spearman correlation of signature score of Macro_APOE and CD8Teff_2 (right) in patient #19. (c) The same as a but in patient #36. (d) The same as b but in patient #36.

