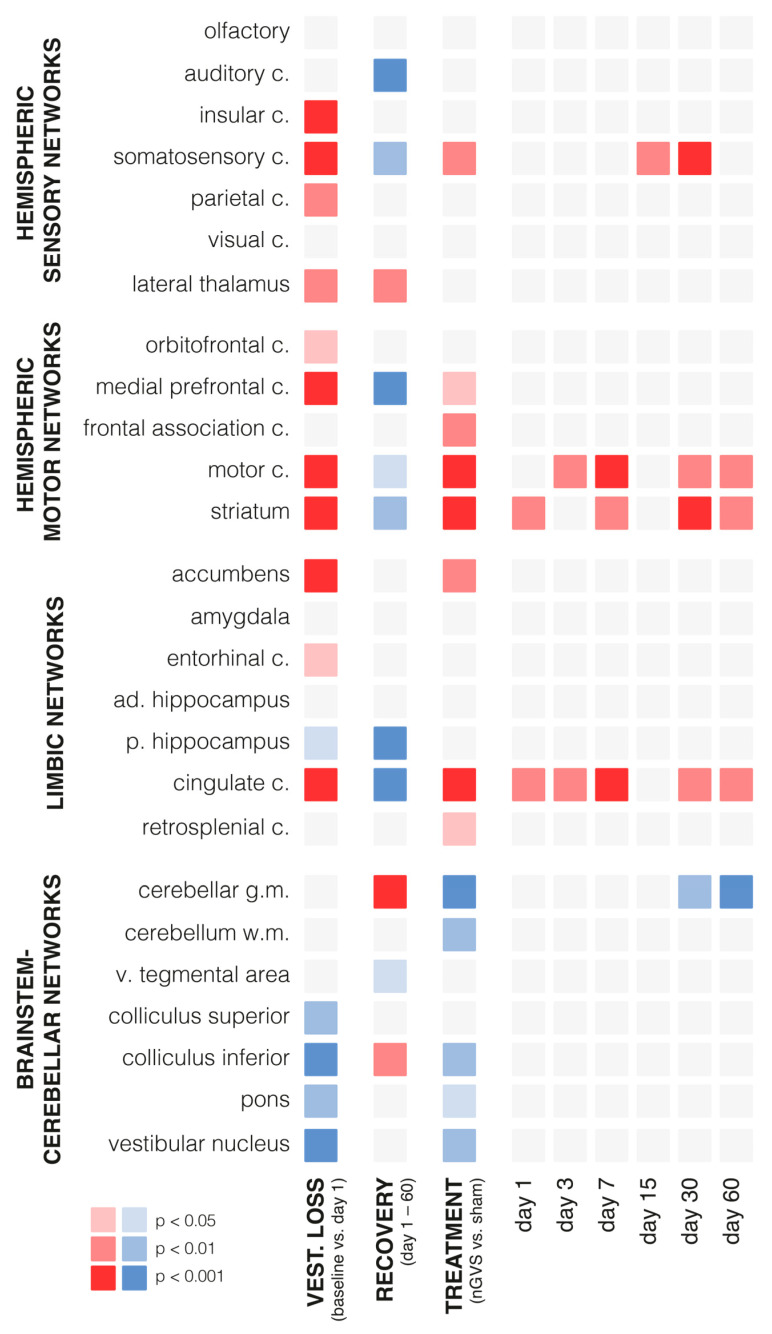
Figure 2.
Changes in regional brain activity in response to bilateral labyrinthectomy and low-intensity vestibular noise stimulation. Overview of changes in mean normalized levels of brain activity in 26 selected brain regions measured by 18F-FDG-PET. Significant increases in activity are visualized in red (light red: p < 0.05; medium red: p < 0.01; dark red: p < 0.001) and decreases in activity in blue (light blue: p < 0.05; medium blue: p < 0.01; dark blue: p < 0.001). The first column: instantaneous changes in response to bilateral labyrinthectomy (baseline vs. day 1); the second column: changes within the course of recovery (days 1–60 post-bilateral labyrinthectomy); the third column: changes in response to low-intensity vestibular noise stimulation (nGVS vs. sham); the fourth to ninth columns: time-dependent changes in response to vestibular noise stimulation, i.e., decomposition of significant interaction effects between recovery time and treatment. Abbreviations: nGVS: noisy galvanic vestibular stimulation; vest: vestibular; c: cortex; ad: anterior-dorsal; p: posterior; v: ventral.

