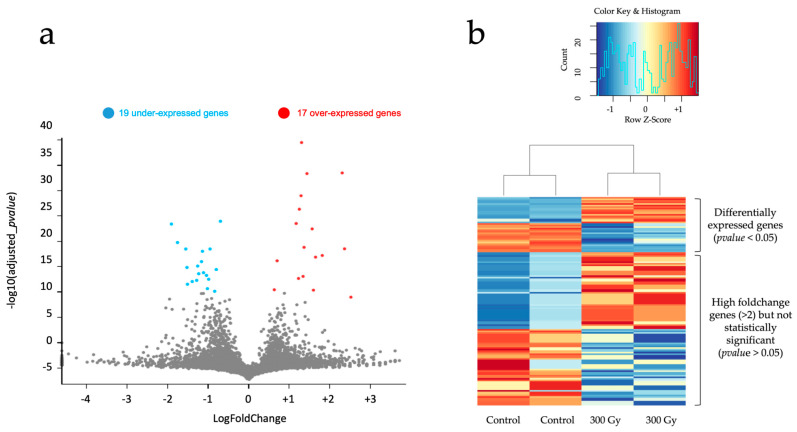
Figure 5.
Bulk transcriptomic analysis of cellular expression differences in two C. elegans samples containing multiple pooled replicates following selective irradiation. (a) Volcano plot of differentially expressed (DE, gray dots) genes in the 300 Gy condition compared to the control. DE genes were computed by fitting a linear model on each gene, extracting contrasts and performing an empirical Bayes test. The genes with a p-value < 0.05 (after Bonferroni correction) are considered as DE. (b) Heatmap of relative gene expression between control and 300 Gy samples on the 36 DE genes and 100 high foldchange genes (>2), 50 up-regulated and 50 down-regulated genes, not classified as DE. The 100 high foldchange genes selected were the top 50 highest foldchange in up-regulation and down-regulation.

