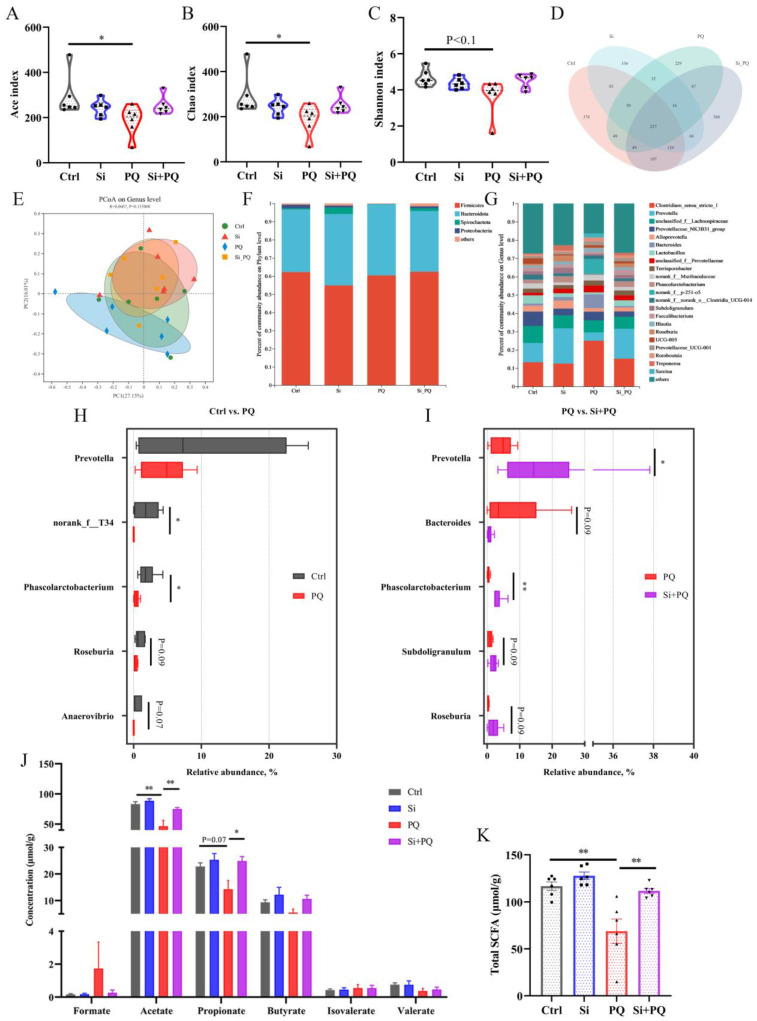
Figure 6.
Dietary silybin addition improved PQ-induced intestinal microbiota disorders. (A–C) α-diversity index. (D) Ven diagram of ASV in cecal chyme of all samples. (E) Principal coordinate analysis. The relative abundance of gut microbiota at the phylum (F) and genus level (G). (H,I) Gut microbiota with significant differences of the comparison groups Ctrl vs. PQ and PQ vs. Si + PQ at the genus levels. (J,K) The concentration of cecal short-chain fatty acids. Data are expressed as mean ± standard error. * p < 0.05 and ** p < 0.01. Ctrl = basal diet group treated with saline; Si = silybin diet group treated with saline; PQ = basal diet group treated with paraquat; Si + PQ = silybin diet group treated with paraquat; PCoA = principal coordinates analysis; and SCFAs = short-chain fatty acids.

