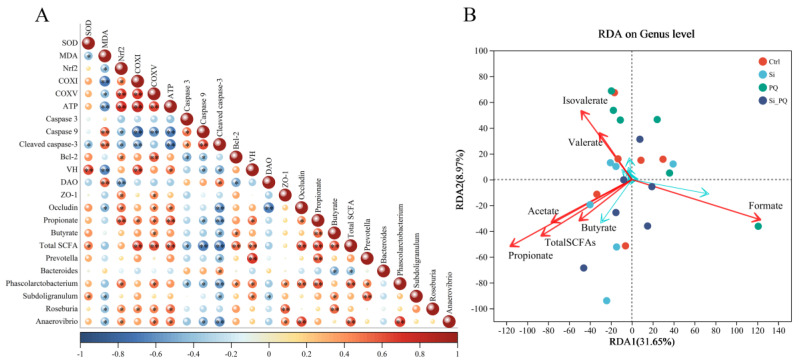
Figure 7.
Spearman correlation analysis and RDA analysis. (A) The heatmap of Spearman’s correlation between the abundance of gut microbiota and the intestinal homeostasis phenotype indexes. (B) The RDA of the differences between the gut microbiota and SCFA levels. * p < 0.05 and ** p < 0.01. CAT = catalase; SOD = superoxide dismutase; MDA = malondialdehyde; Nrf2 = nuclear factor-erythroid 2-related factor 2; COX = mitochondrial complex; ATP = adenosine triphosphate; ATP5H = ATP synthase subunit d; VH = villus height; V/C = the ratio of villus height-to-crypt depth; DAO = diamine oxidase; ZO-1 = zonula occludens-1; SCFAs = short-chain fatty acids; and RDA = redundancy analysis.

