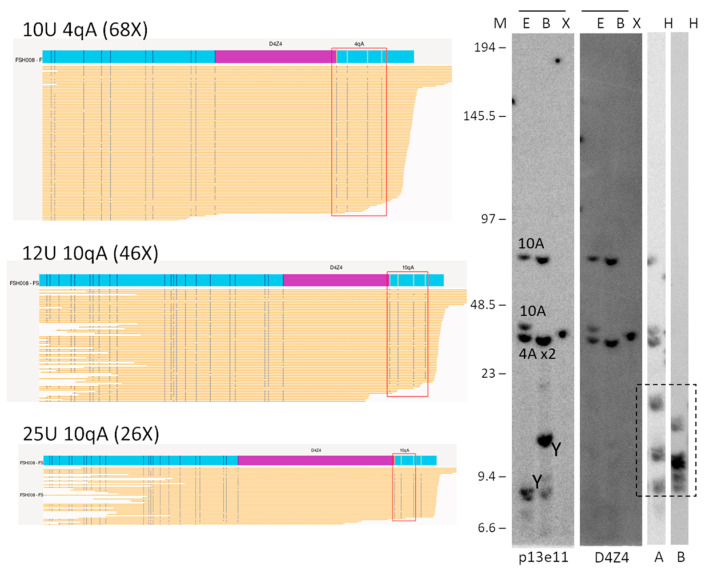
Figure 3.
Comparison of OGM (EnFocus FSHD analysis (version 1.0; Bionano Access Software v1.7)) and SB hybridisation and SSLP haplotyping for the analysis of proband FSH008 with homozygous 10 U alleles. The OGM output files (left panel) show one Chr 4 map with a higher number of reads, suggesting the presence of a homozygous D4Z4 region. SB analysis (right panel) showed hybridisations with probes p13E-11 and D4Z4 on genomic DNA digested using the enzymes EcoRI/HindIII €, EcoRI/BlnI (B), and XapI (X) and hybridisations with probes A and B on genomic DNA digested with HindIII (H). The alleles based on the different blots are indicated in the p13E-11 blot. The chromosome Y fragment is indicated, and the cross-hybridising fragments in the A/B hybridisations are marked with a dotted box. The size of the molecular weight marker is indicated on the left. Original blot images can be found in Figure S1.

