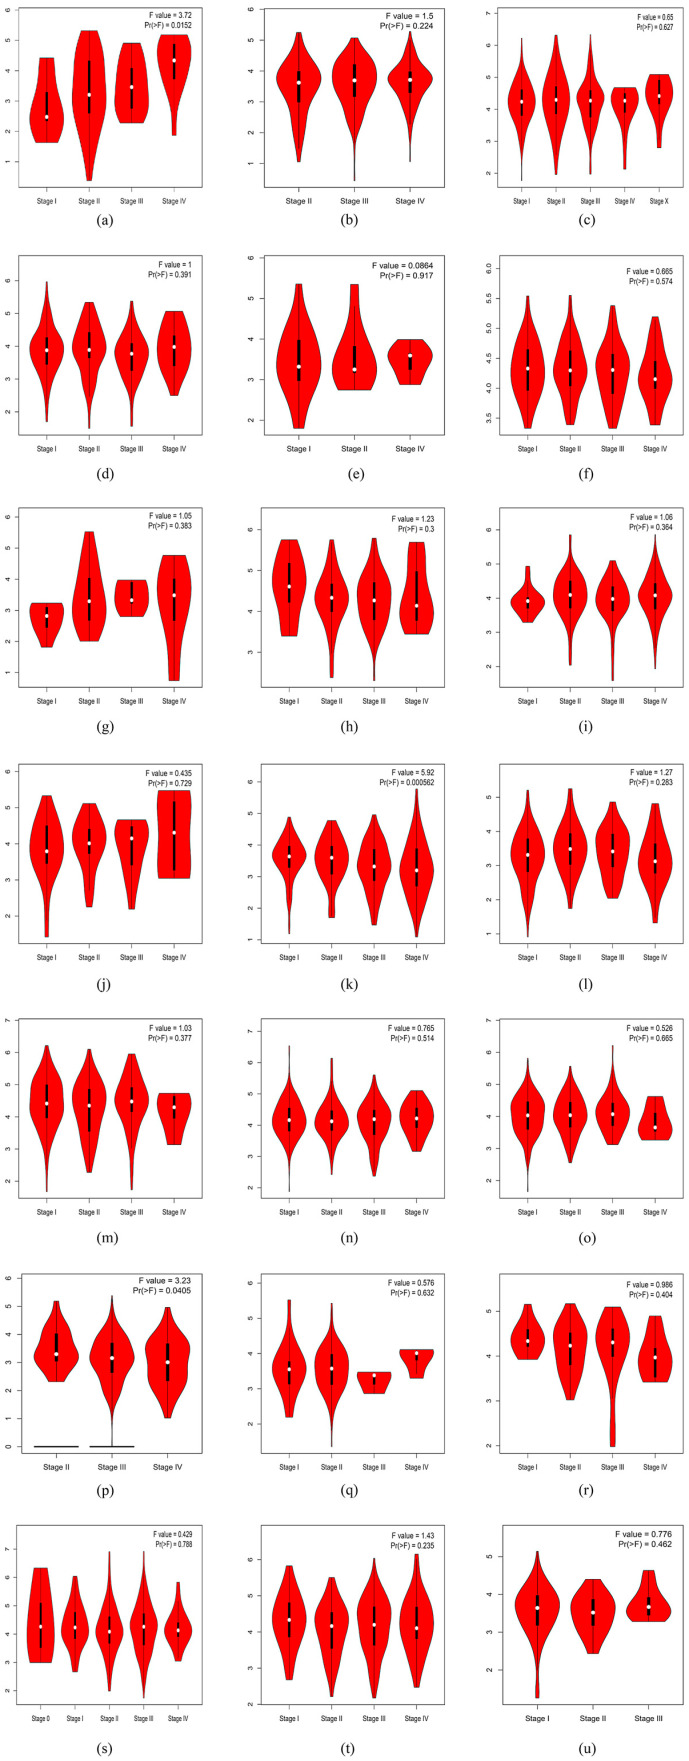
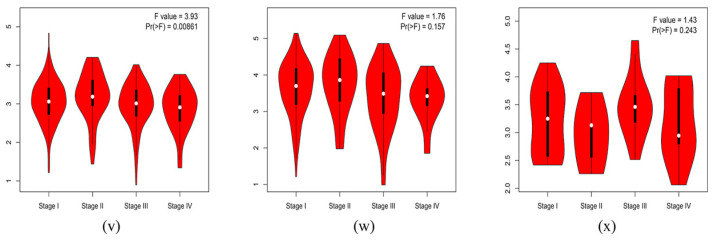
Figure 2.
Correlations between the SLC31A1 expression and the tumor, including the (a) ACC, (k) KIRC, (p) OV, and (v) THCA pathological stage from GEPIA. Log2 (TPM+1) was used for the log scale. (a–x) Represent images of SLC31A1 gene in relation to pathologic staging in ACC, BLCA, BRCA, CESC, CHOL, COAD, DLBC, ESCA, GBM, HNSC, KICH, KIRC, KIRP, LIHC, LUAD, LUSC, OV, PAAD, READ, SKCM, STAD, TGTC, THCA, UCEC, UCS.


